
Monthly Market Compass: November 2025
The Government shutdown continues! Gold and Crypto see a choppy month. The Fed signals that a December rate cut is not a foregone conclusion. Is Alt-season still happening?
Hello again, and welcome to our Monthly Market Compass for November 2025. We send these chart heavy market summaries at the beginning of each month.
Please be aware that these notes are not investing advice and should be enjoyed as entertainment and for informational purposes only. Always do your own research. Sources can be found below each graphic.
As usual, we divide these monthly notes into several sections: an introduction and inflation section, an economy section, a liquidity section, a Fed-focused section, a geopolitics and commodities section, a crypto section, which is followed by an equities section. A market conclusion follows these sections. Enjoy!
Introduction and Inflation:
Welcome back to another month!
Just a quick reminder that if you are not signed up for our $10-a-month subscription, you will not be able to read this entire article. If you enjoy these blogs, please help by supporting this Substack and subscribing for only $10 a month or $100 a year.
The US government shutdown continues amid a wave of market confusion as a narrow set of tech companies lift the equities market while gold, silver, and crypto experience drawdowns.
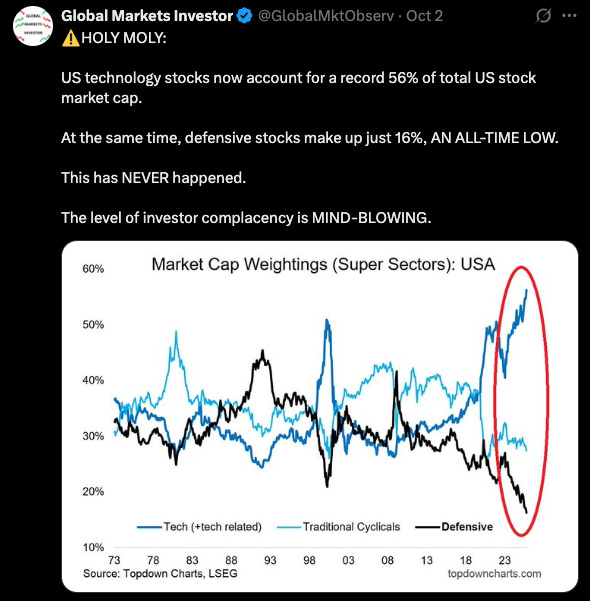
Source: https://x.com/GlobalMktObserv/status/1973795113907183900
Markets seem gripped by a bevy of scenario-pairs that no one seems to know the outcome of:
Will the ongoing government shutdown end shortly, or will it be protracted?
Will the Fed cut rates in December or not?
Where will inflation head in the months ahead?
Will the AI boom narrative fizzle out amid declining returns and skepticism or become a productivity boom?
Will the employment disruptions caused by AI in the labor market have a happy ending, or will unemployment remain untethered from equities going forward?
Will this equity market look more like 1998 or 2008?
If we are in a tech boom similar to the late 90s, are we in 1999, or in late 2000?
In last month’s note, amid the freshly announced government shutdown, I showed Kalshi betting market’s estimated likelihood for the length of the shutdown, which was 13.5 days. Currently, as we approach the 40-day mark of the shutdown with no clear resolution in sight, the current Kalshi estimate stands at 43 days:
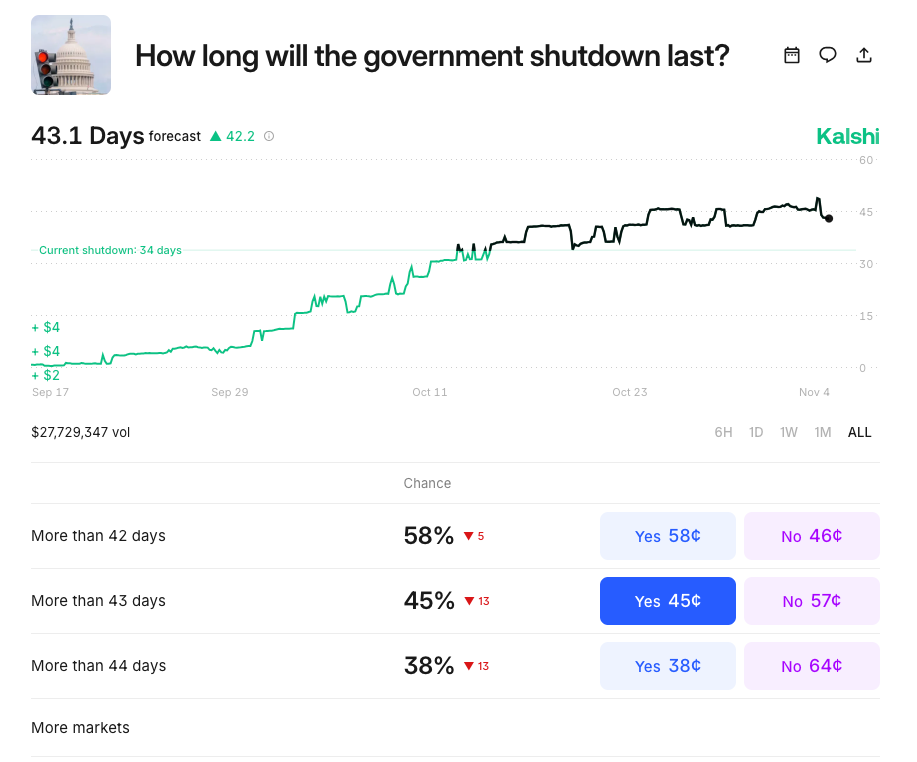
Source: https://kalshi.com/markets/kxgovshutlength/days-of-government-shutdown
Without any special insight into this dynamic, my mind turns to the uniqueness and heightened levels of animosity between the Republican and Democratic parties at this point in US history and what seem like unique occurrences over the last few years in politics.
These circumstances make me worry that this shutdown will last longer than people expect.
So with that concern voiced, we’ll consider markets with a longer horizon, as this immediate term seems a bit more inscrutable than at other times.
The US still has an enormous debt load, which continues to impact US fiscal spending as interest rate expenses rise:
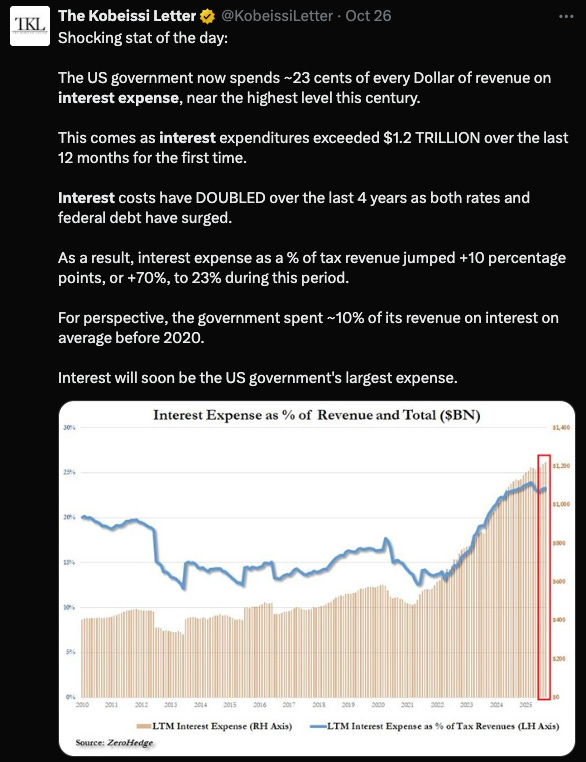
Source: https://x.com/KobeissiLetter/status/1982525468357153027
We’ve written in the past about how we expect the USD to weaken further and noted last month that the USD was experiencing its worst year on record.
Early in October, the USD index found support on its 14-year trendline to move slightly higher:
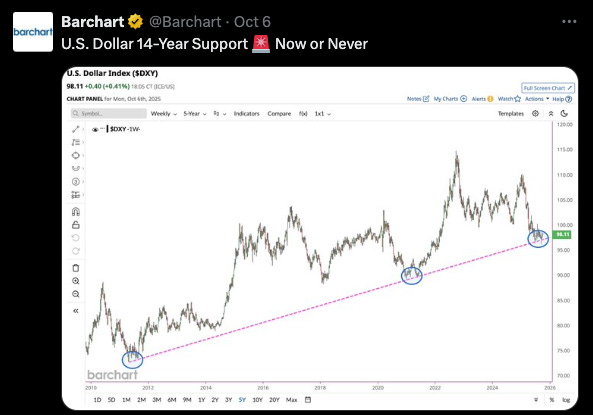
Source: https://x.com/Barchart/status/1975339316990947819
Eventually, we expect the USD to weaken against global currencies, but at the moment, this failure to break the USD strengthening trendline is weighing heavily on assets like gold, silver, cryptos, and other commodities.
Since early October, the USD has continued to strengthen:
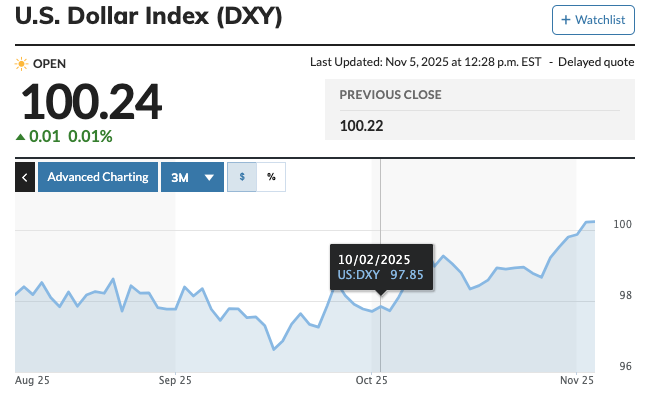
Source: https://www.marketwatch.com/investing/index/dxy
And much of what has happened in markets over the last few weeks is, in my view, related to this dollar strength.
We’ve harped on the disconnect between gold and long-term Treasuries for months now. That idea has now been named the “debasement trade,” which can be seen easily here:
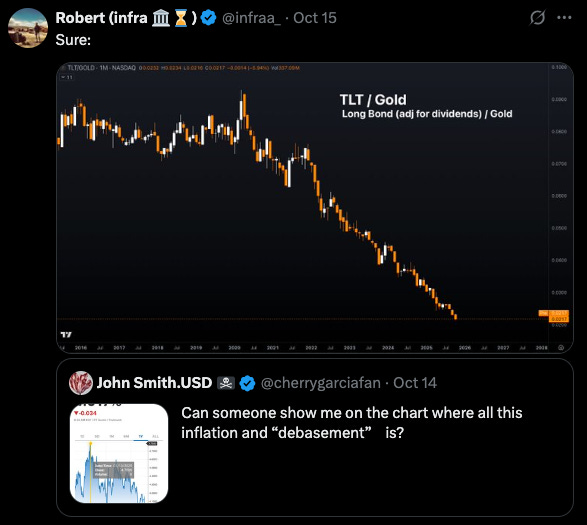
Source: https://x.com/infraa_/status/1978442447777648999
Gold has experienced some selling this past month, though it was up a small amount over the entirety of October.
An extreme comparison to what is happening today is to look at what happened to gold in Germany from the 1910s through the 1920s.
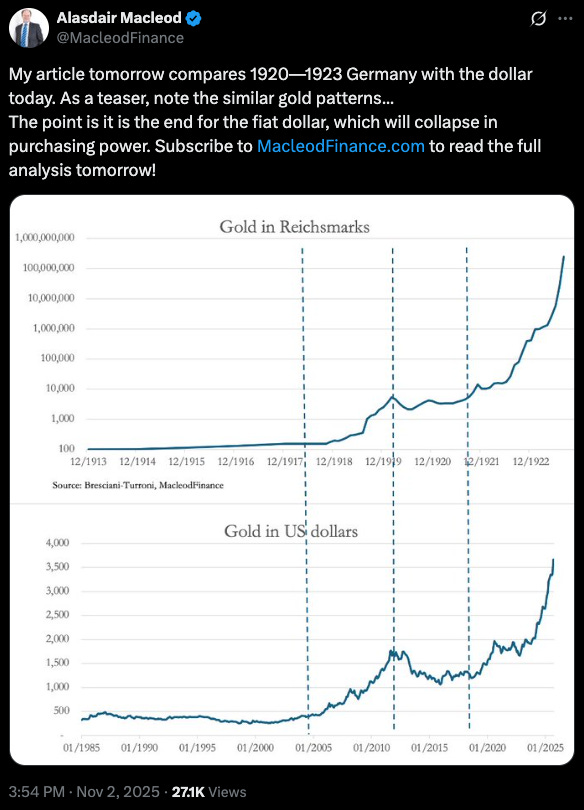
Source: https://x.com/MacleodFinance/status/1985118266491322434
Those downturns in gold were experienced as enormous fluctuations in the nominal price:
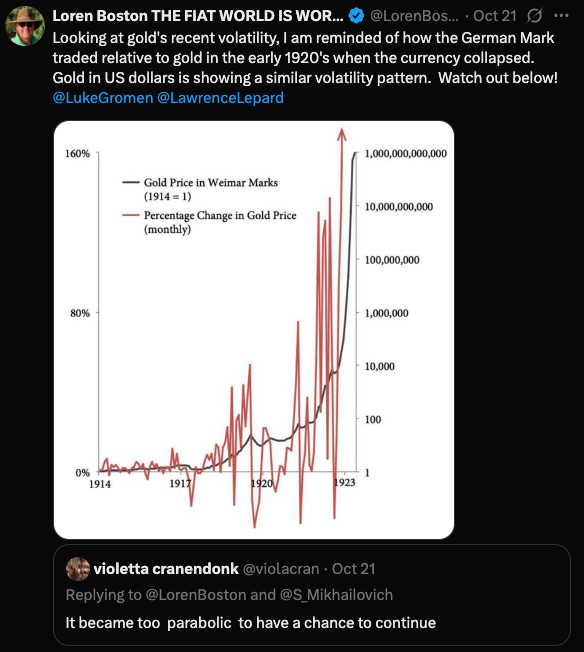
Source: https://x.com/LorenBoston/status/1980628487141814607
In global bond markets, last month we highlighted the selloff in European bonds, but the same thing is happening with Japanese bonds as well:
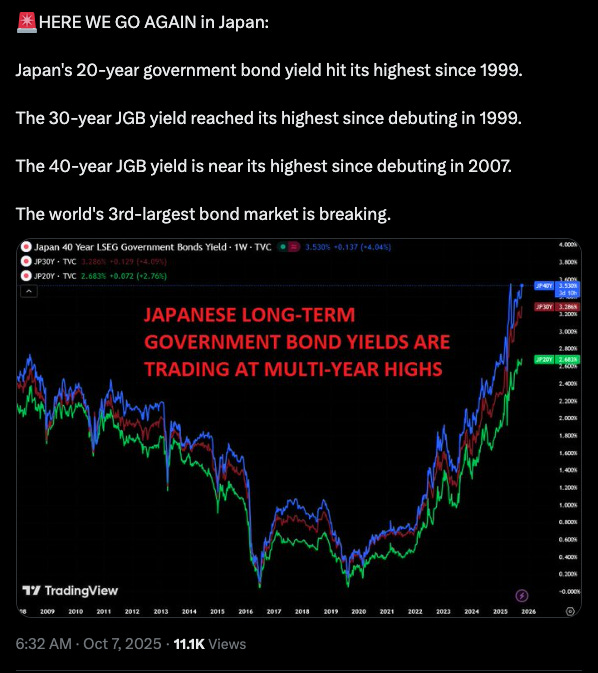
Source: https://x.com/TaviCosta/status/1974083609930969593
Turning to inflation, we’ve seen an upswing in both the Truflation number:
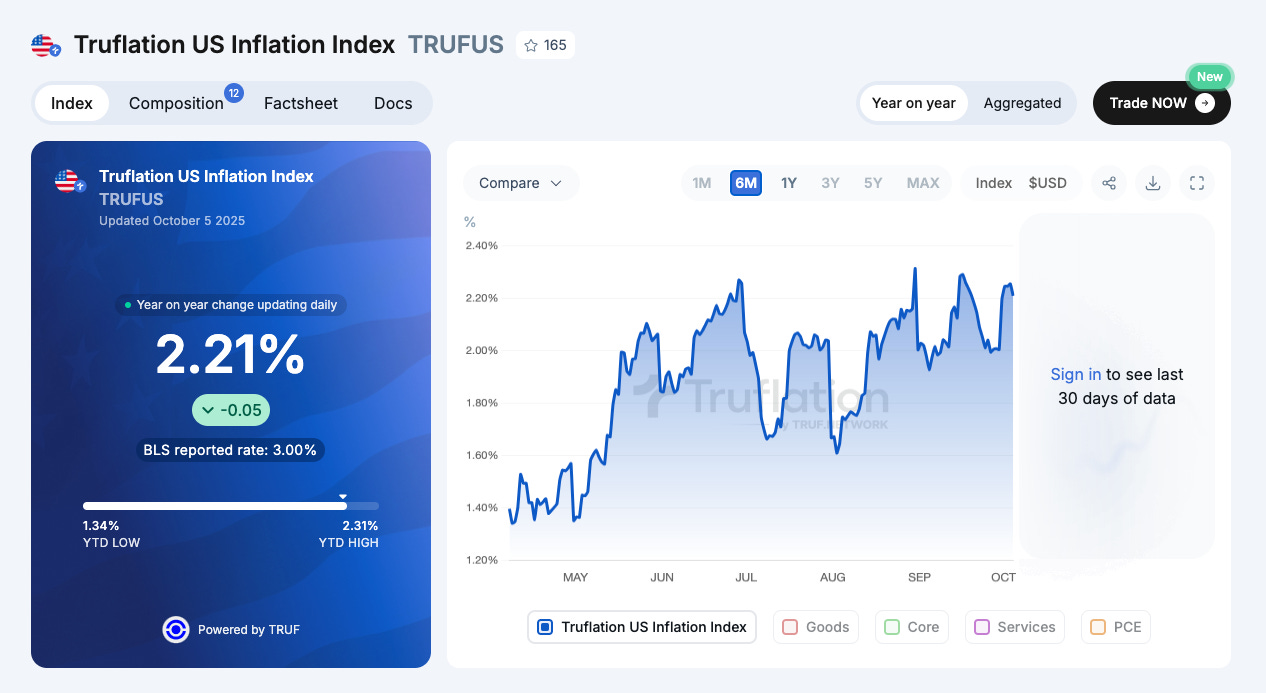
Source: https://truflation.com/marketplace/us-inflation-rate
As well as the official BLS CPI:
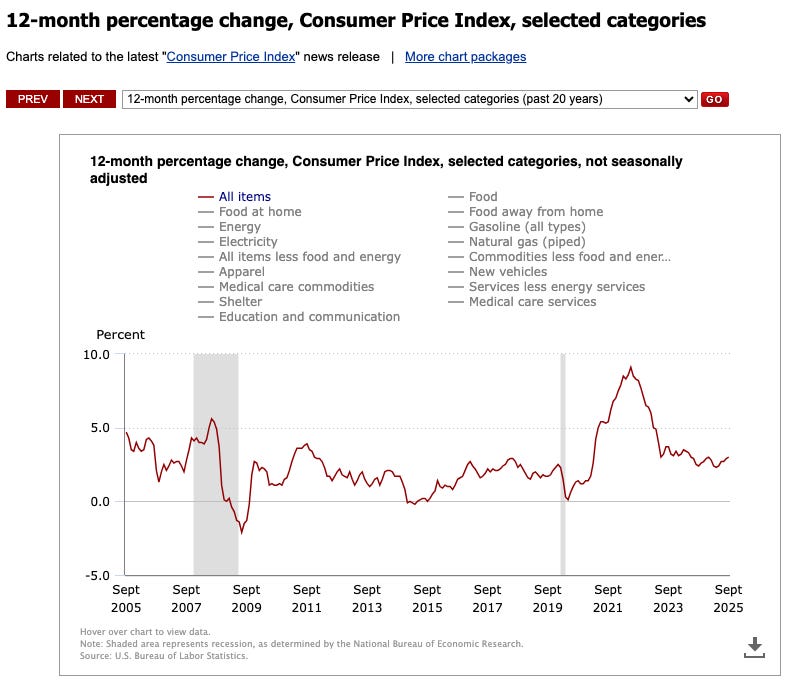
Source: https://www.bls.gov/charts/consumer-price-index/consumer-price-index-by-category-line-chart.htm
As an aside, the CPI has inputs imputed at 40% of all inputs, so perhaps the disconnect between CPI and the (perceived more accurate) Truflation is attributable to this:
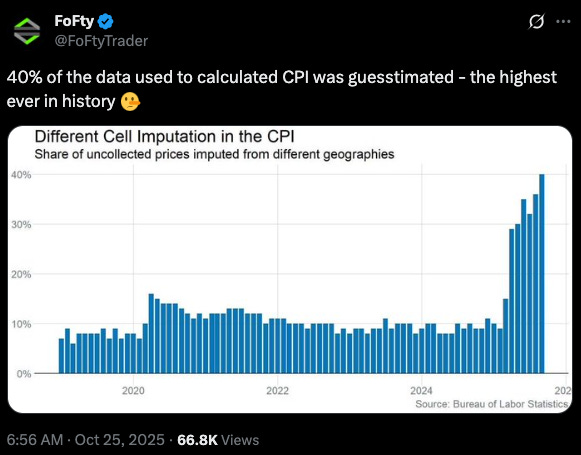
Source: https://x.com/FoFtyTrader/status/1982068805330518264
Some models are showing inflation will collapse further:
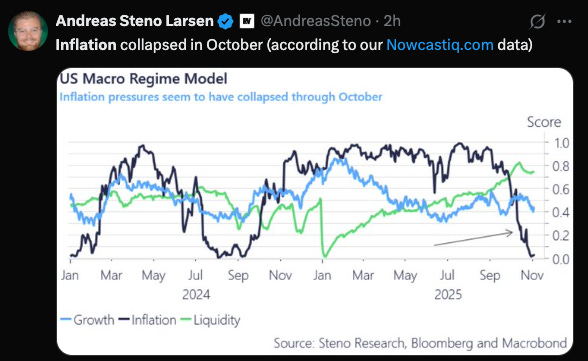
Source: https://x.com/AndreasSteno/status/1986161990243422404
But the direction of other indicators—like commodities—is pointing in the opposite direction:
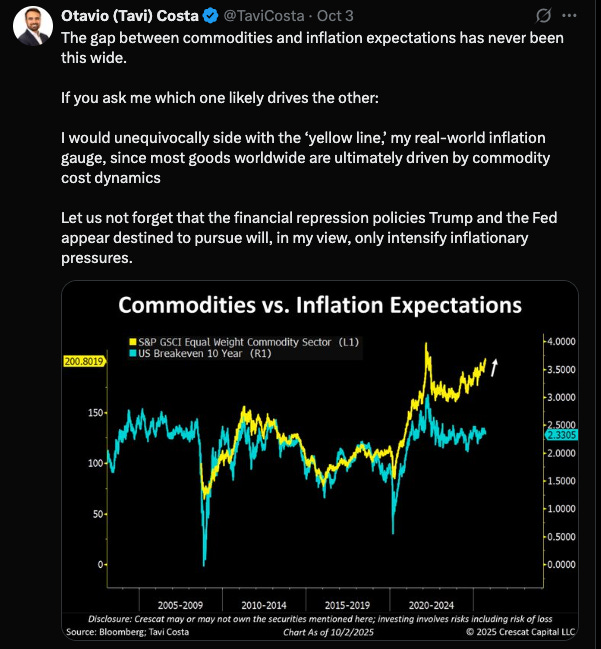
Source: https://x.com/TaviCosta/status/1974083609930969593
CPI against gold tells a similar story:
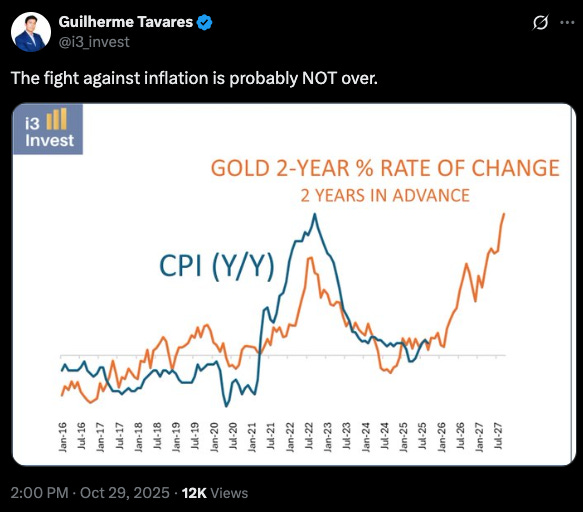
Source: https://x.com/i3_invest/status/1983624885592076367
As does ISM prices paid:
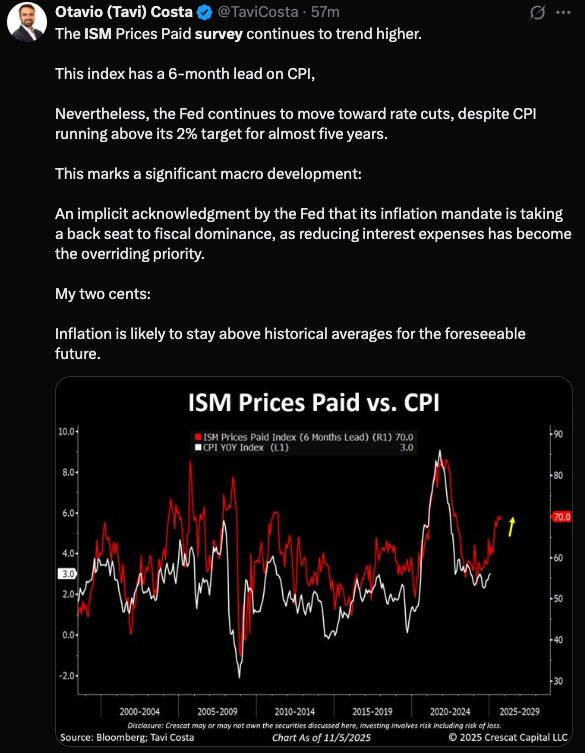
Source: https://x.com/TaviCosta/status/1986207659276837168
Short-term, inflation could dip over the next two months as lagging factors like rent and housing cool off. But zoom out five to ten years: the USD faces a massive weakening, fueling hotter-than-expected inflation. The mid-term? Still murky, but tilting toward upside pressure—watch commodities and ISM prices for clues.
