
Monthly Market Compass: March 2026
Iran War in focus - Hormuz remains closed as oil field shutdowns begin. The 25-day storage wall is real - but the market pain is asymmetrically distributed.
Hello again, and welcome to our Monthly Market Compass for March 2026. We send these chart-heavy market summaries at the beginning of each month.
Please be aware that these notes are not investing advice and should be enjoyed as entertainment and for informational purposes only. Always do your own research. Sources can be found below each graphic.
As usual, we divide these monthly notes into several sections: an introduction and inflation section, an economy section, a liquidity section, a Fed-focused section, a geopolitics and commodities section, a crypto section, which is followed by an equities section. A market conclusion follows these sections. Enjoy!
Introduction and Inflation:
Welcome back after an eventful month! We are making this month’s Market Compass free for all subscribers with everything going on.
But just a quick reminder that if you are not signed up for our $10-a-month subscription, you will not be able to read our other Market Compasses (both previous and future). So, if you enjoy this post, please help by supporting this Substack and subscribing for only $10 a month or $100 a year.
Years from now, when historians tally the score of this past month, the likely most important event will be tallied as the decision by US and Israeli forces to strike Iran.
That single act has set off a chain of events that could resolve as a controlled military engagement lasting weeks - or escalate into something the global financial system hasn’t priced.
We’ll get to all of it in the Geopolitics section. But we need to set the stage first.
Because the macro conditions that existed before February 28 didn’t disappear when the missiles launched. They arguably got worse.
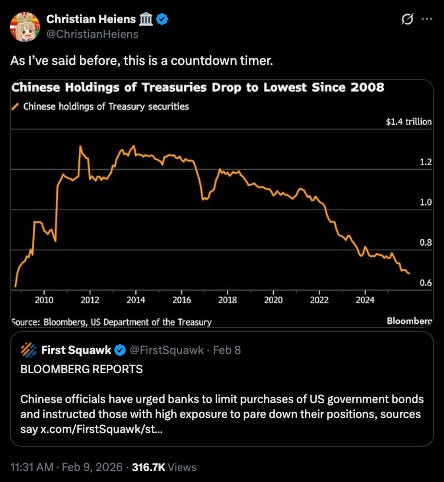
Total US debt continues to climb. Interest expense continues to consume a growing share of federal spending.
China’s holdings of USTs continue to drop as they add Gold:
Source: https://x.com/ChristianHeiens/status/2020928579740237979
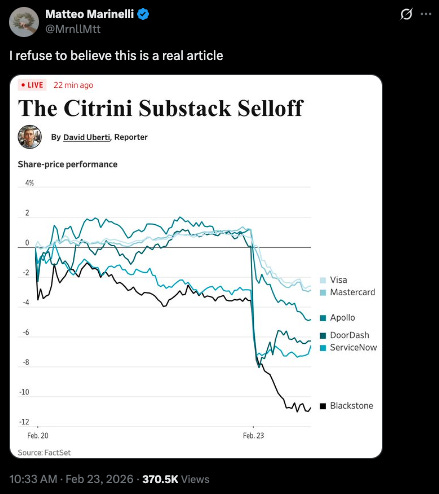
A report by Citrini Research triggered a selloff in various software and AI susceptible companies as a continuation of that theme that we’ve highlighted in previous months:
Source: https://x.com/MrnllMtt/status/2025987504113877037
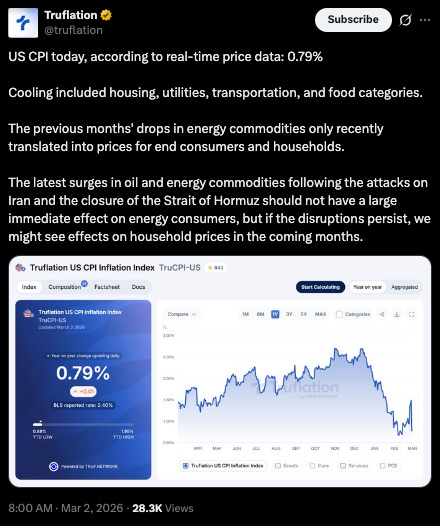
Truflation continues to point towards lagging data in the official CPI:
Source: https://x.com/truflation/status/2028485575129641361
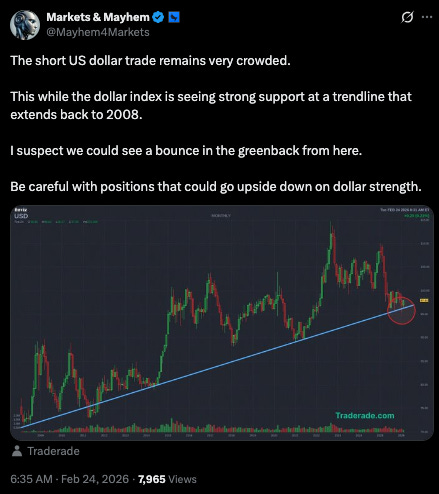
The US Dollar continues to flirt with its DXY 14-year trendline break, which we noted last month:
Source: https://x.com/Mayhem4Markets/status/2026289900060901443
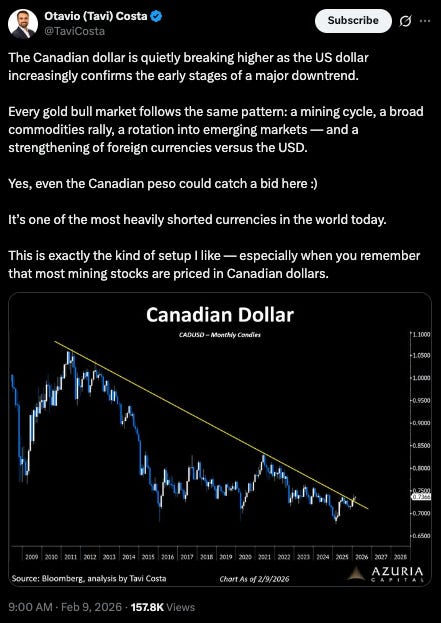
We noted last month that many currency movements against the USD are contributing to that DXY weakness.
And this month we would add the Canadian dollar to that list:
Source: https://x.com/TaviCosta/status/2020890643585978406
For months we’ve been showing the two potential paths for equity markets as a 1998 vs. 2008 retread.
Here’s what the current 2008 analogue looks like:
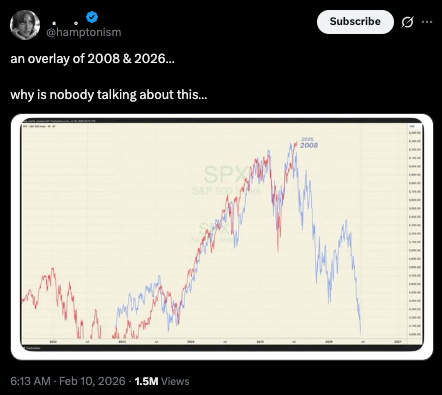
Source: https://x.com/hamptonism/status/2021210823675318676
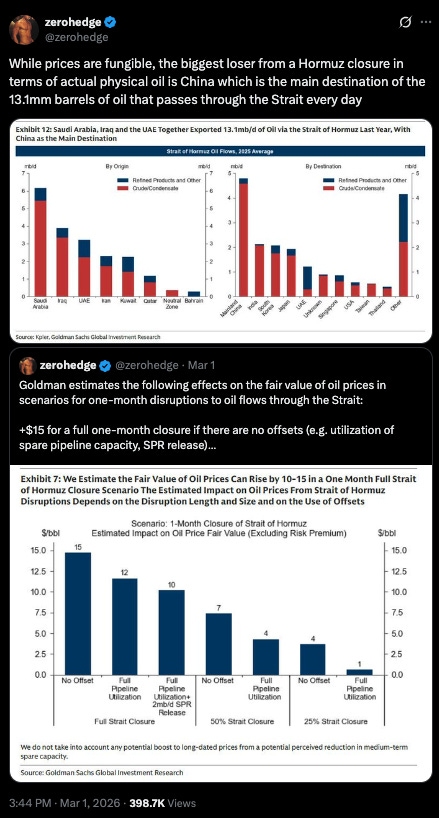
In my view, closing the Strait of Hormuz will function like a tariff on the global energy supply - but one that hits America’s competitors harder than America.
The US produces 13.5M b/d and is the world’s largest LNG exporter. Europe imports both. China gets 70% of its crude through the Strait.
So, this is an inflationary shock with asymmetric pain distribution.
US Treasuries have seen a bit of volatility in the aftermath of the attack on Iran.
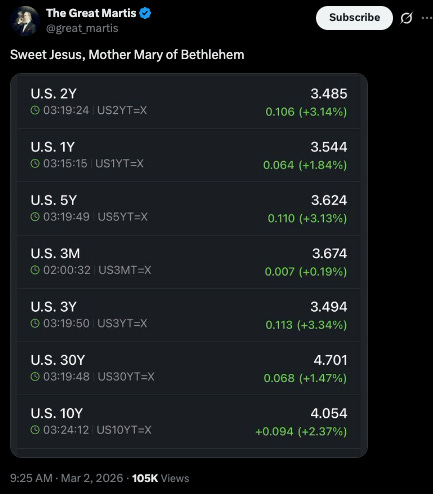
Source: https://x.com/great_martis/status/2028507029107798165
Japan continues to decouple from the US Treasury market (which we saw last month), seen here looking at USDJPY vs. UST 10yr - 10yr JGB:
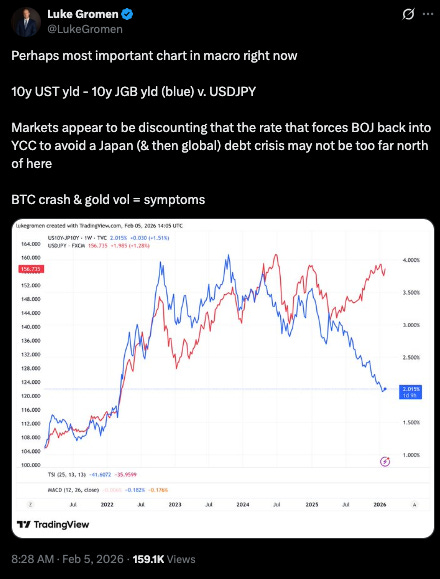
Source: https://x.com/LukeGromen/status/2019432903328067959
As Japan’s yields explode:
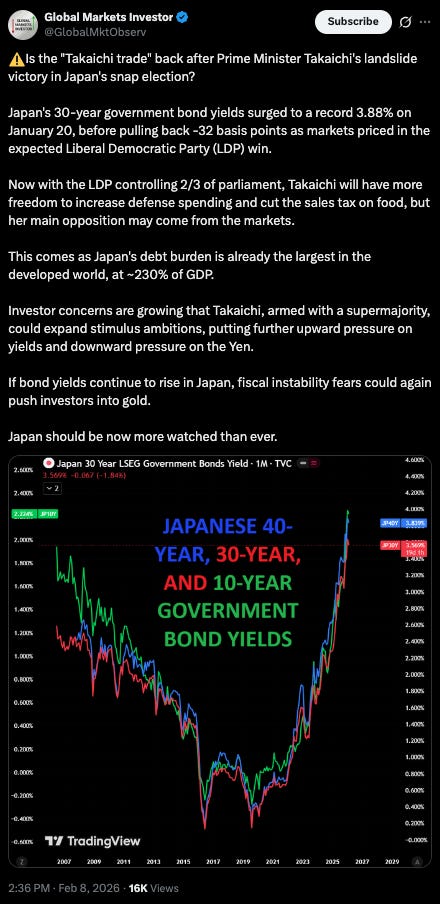
Source: https://x.com/GlobalMktObserv/status/2020612792966119436
And even before Iran happened, the world was at all-time high levels of financial uncertainty:
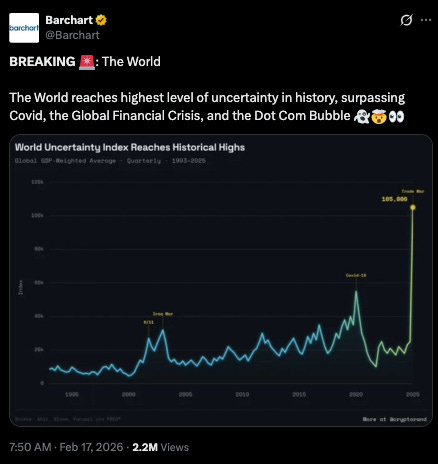
Source: https://x.com/Barchart/status/2023772126696636869
And with that, let’s dive in!
Economy Watch:
The AI space remains the linchpin of the US economy - with dramatic expectations in the various bull and bear camps:
Source: https://x.com/balajis/status/2026629513568797035
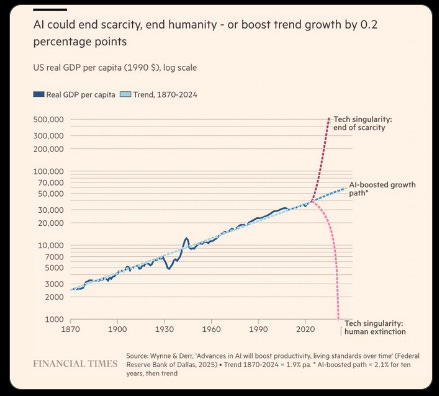
The ‘end-of-scarcity’ bull case for AI echoes some of the ideas around an AI singularity, which would grow exceptionally capable in a short period of time. Interestingly, charts showing that level of progress are starting to show up:
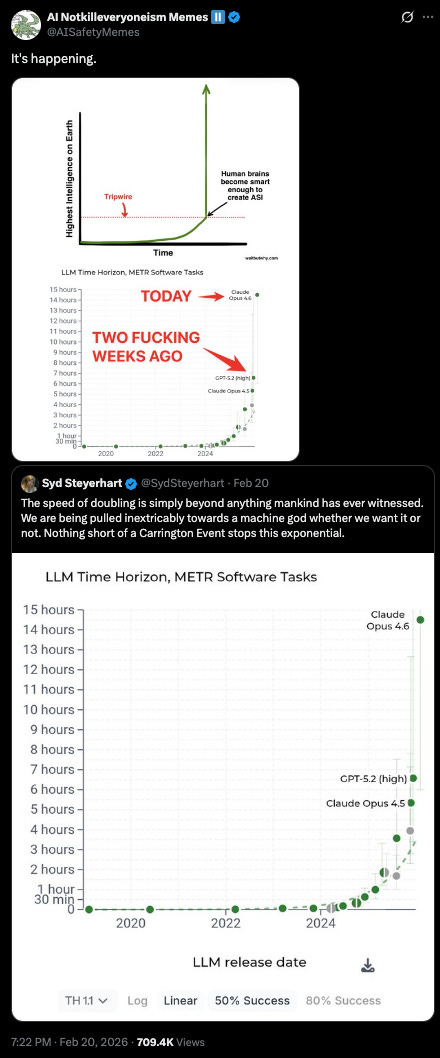
Source: https://x.com/AISafetyMemes/status/2025033374562148433
Similarly, the amount of text generated by AIs has eclipsed the amount of text ever written by humans:
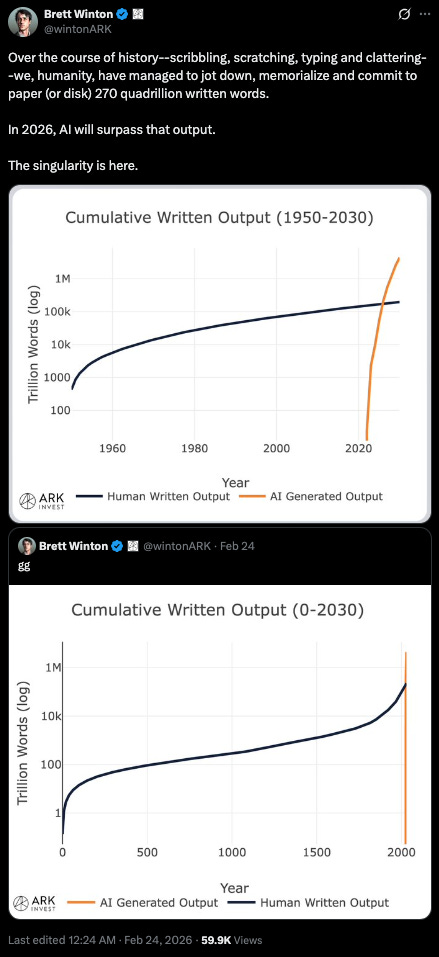
Source: https://x.com/wintonARK/status/2026196515782590595
We can debate the quality of AI-generated words for the moment, but the likely path is that AIs start to become very good at determining the quality of all written words, as the volume of text written by AIs simultaneously grows.
At the moment, AI-driven productivity gains (Q3 2025 productivity at 4.9%, with unit labor costs falling 1.9%) remain the bull case against recession.
For data on that look no further than the relevant vibe-coding-fueled growth in new websites, iOS apps, and Github code:
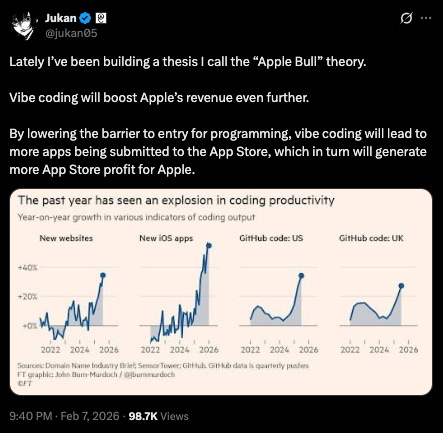
Source: https://x.com/jukan05/status/2020357025851757045
However, the productivity thesis is being stress-tested in real time.
Software stocks continue to sell off (more on that later), but the physical AI infrastructure layer (power, chips, data centers) is holding.
The bifurcation matters: the digital layer is deflating while the physical layer inflates.
The large US tech companies continue to finance hyperscaler data centers despite growing concerns about their ultimate profitability:
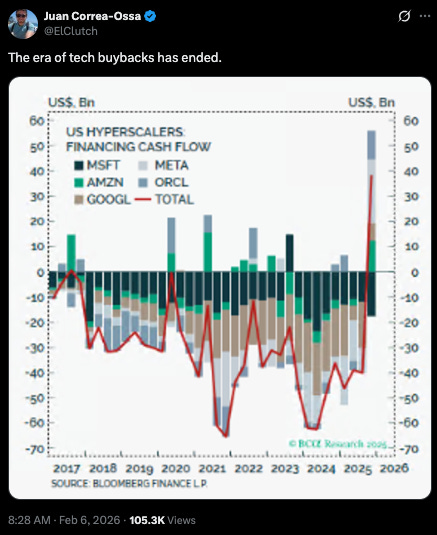
Source: https://x.com/ElClutch/status/2019795247300055091
General office construction projects were just eclipsed by data center construction in terms of CAPEX:
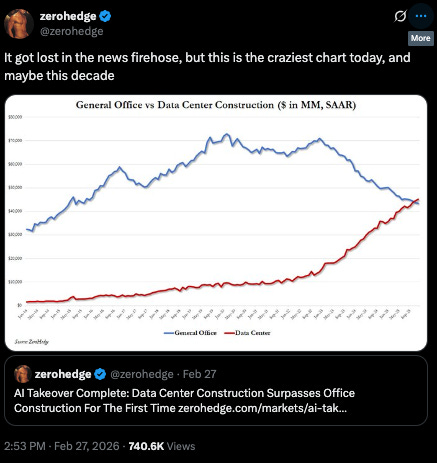
Source: https://x.com/zerohedge/status/2027502345563631685
The credit market on tech is the primary place that the concerns on hyperscaler profitability shows up - in increasing spreads on tech credit compared to the rest of the credit market:
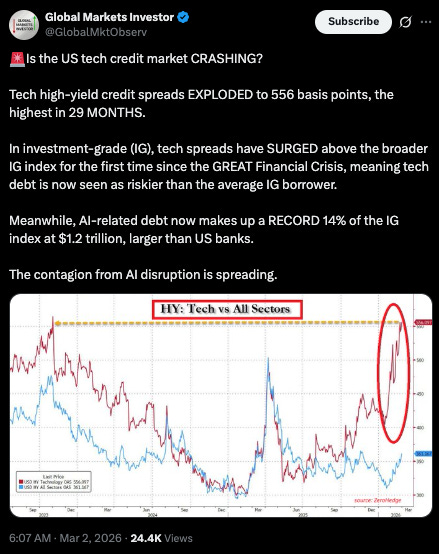
Source: https://x.com/GlobalMktObserv/status/2028457045498753324
Nevertheless, Morgan Stanley expects hyperscalers to double their investments from 2025 - even at these higher spreads:
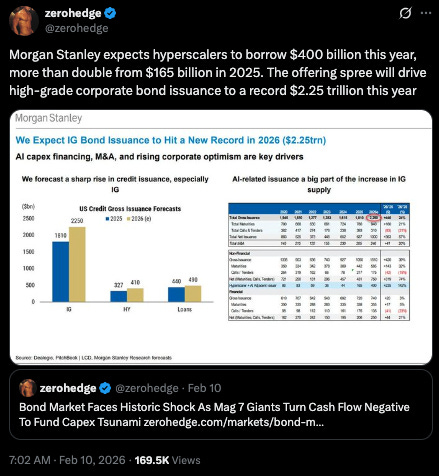
Source: https://x.com/zerohedge/status/2021223200139399667
Turning to the energy component of all the AI investment:
Iran aside, US vs China electricity generation tells a tale of where AI goes in both countries long term:
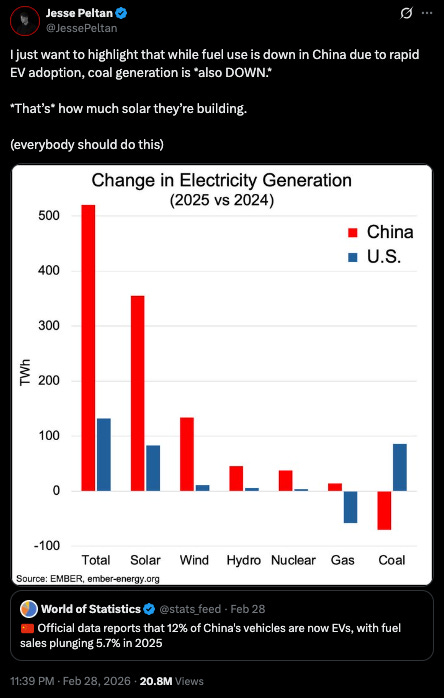
Source: https://x.com/elonmusk/status/2027998216466129266
In the shorter term, it still appears that the US is going to put more of its energy production into AI data centers:
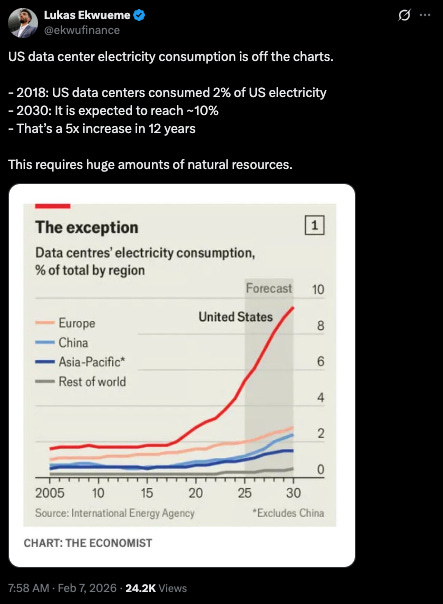
Source: https://x.com/ekwufinance/status/2020150125583032572
AI continues to impact the job market in various ways.
The number of finance jobs has turned south, as -potentially- AI takes another victim:
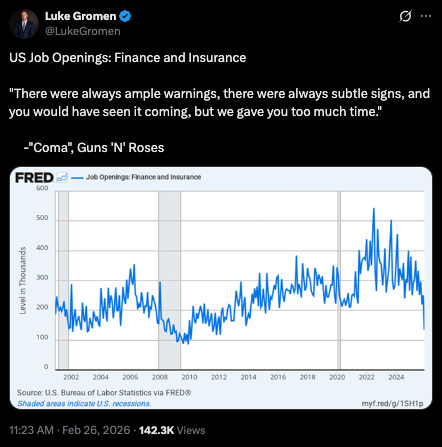
Source: https://x.com/LukeGromen/status/2027087165746823478
We showed last month how AI was causing a massive selloff in Software as Service (SaaS) business model companies. This is still playing out, and we have charts in this note showing the damage.
But interestingly, job postings for software engineers are expanding - possibly as an instance of Jevon’s paradox, where a technology creates more demand for the labor that goes with it:
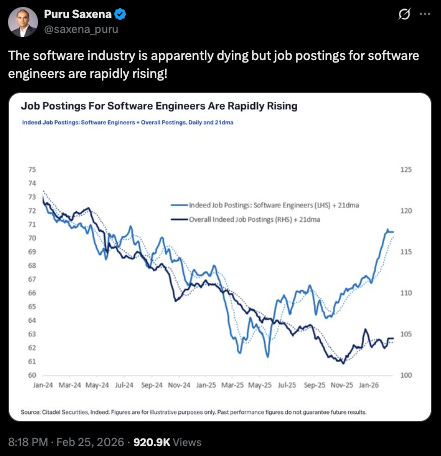
Source: https://x.com/saxena_puru/status/2026859505045352884
It’s certainly an interesting chart, but it’s worth expanding our time horizon and noting that the increase in software engineers is still a long way from where the profession used to be in terms of overall employment:
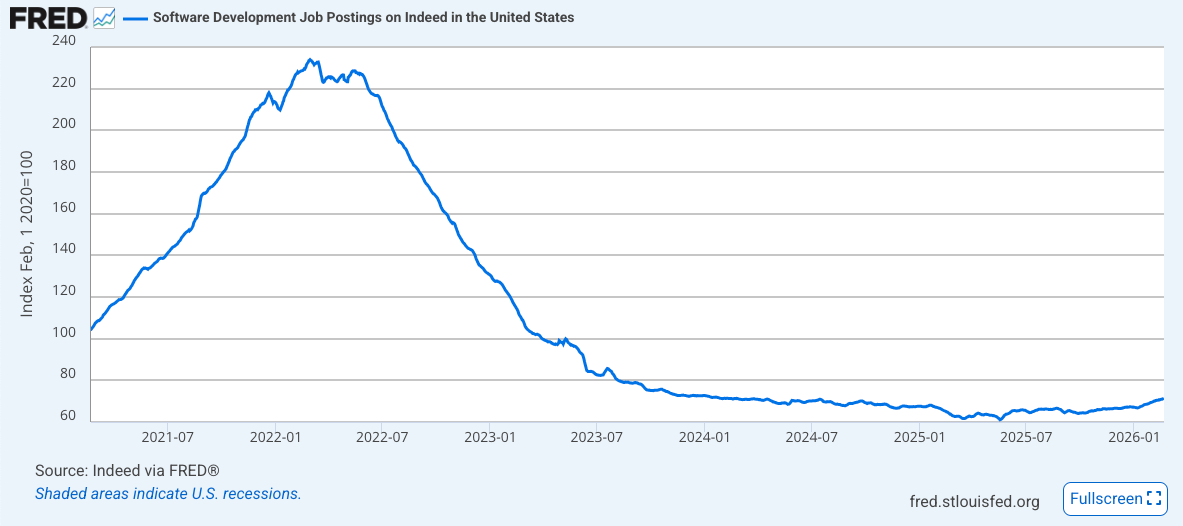
Source: https://fred.stlouisfed.org/series/IHLIDXUSTPSOFTDEVE
We’ve noted for months the tension between the AI 1998 case for the economy, and the 2008 case.
Under normal circumstances if the UST yield curve had steepened over 150 basis points in three years, we would be staring down the barrel of a recession:
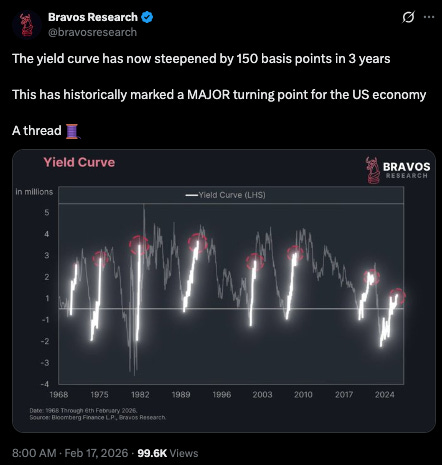
Source: https://x.com/bravosresearch/status/2023774465449246865
But these are not normal times given our post-Covid, fiscal in the driver’s seat world.
Still, looking at labor and unemployment more broadly, the amount of unemployed persons in the US has eclipsed the amount of job openings:
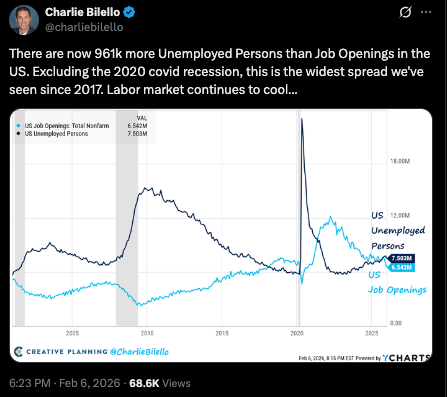
Source: https://x.com/charliebilello/status/2019945064886333589
US layoffs are increasing:
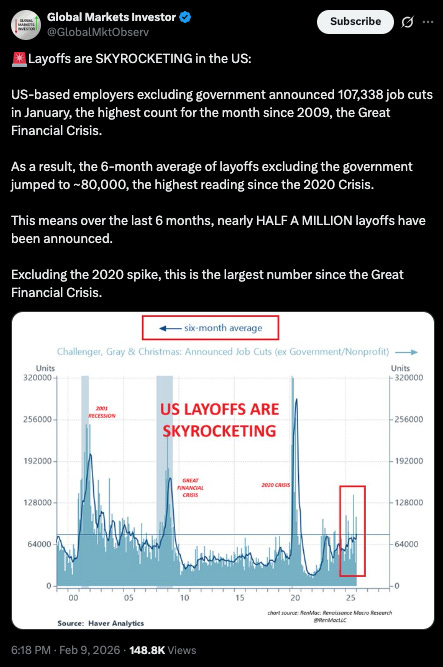
Source: https://x.com/GlobalMktObserv/status/2021030882455261601
US non-farm payroll looks like it is slowing down:
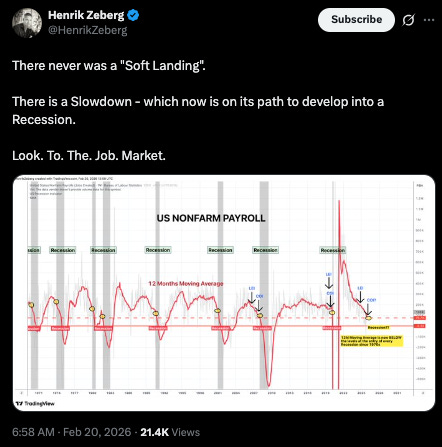
Source: https://x.com/HenrikZeberg/status/2024846184125235330
And to add insult to injury, layoff revisions point to increasing job losses relative to last year:
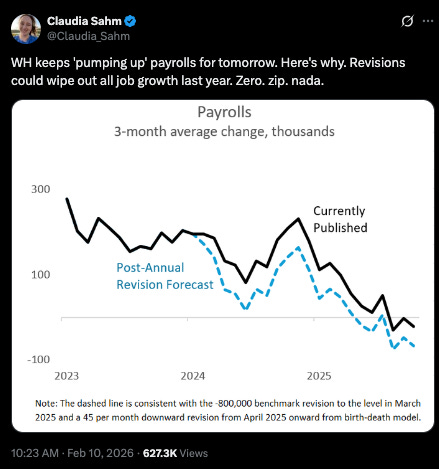
Source: https://x.com/Claudia_Sahm/status/2021273952706810187
Homeowners are in a tough spot, as the number of searches on Google for both ‘help with mortgage’ and ‘can’t sell house’, have reached all-time highs:
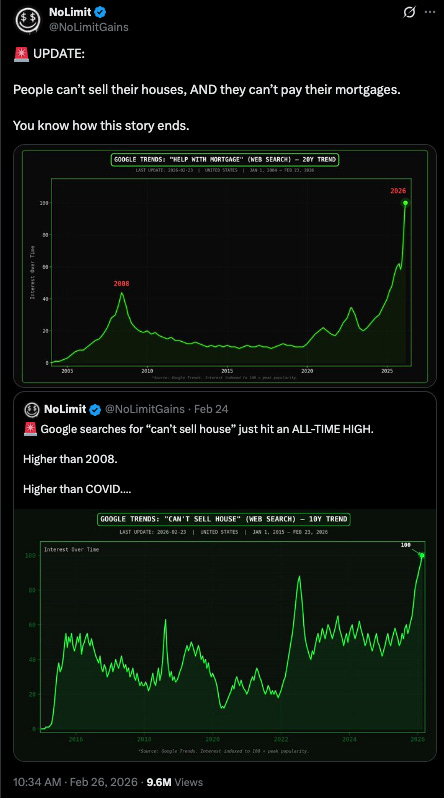
Source: https://x.com/NoLimitGains/status/2027074816444956801
Relatedly, the number of 6%-and-higher mortgages has now moved higher than the number of sub-3% mortgages — as Covid-era homebuyers move and sell their homes.
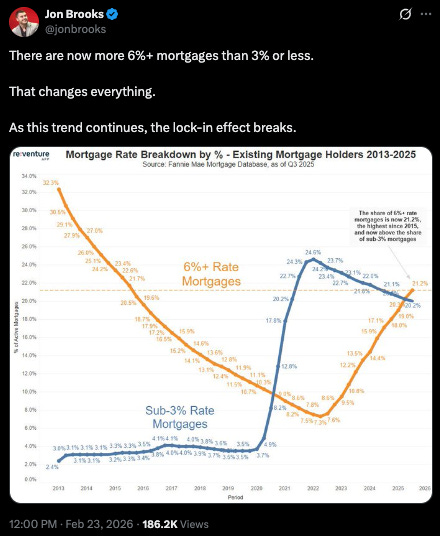
Source: https://x.com/jonbrooks/status/2026009166242865368
The rate and speed of this, along with where mortgage rates go over the coming year or two will likely determine the housing market. The idea being that the longer mortgage rates stay high, the more home prices are likely to fall.
Consumer Stress is still high.
Student loan delinquencies are at decade highs:
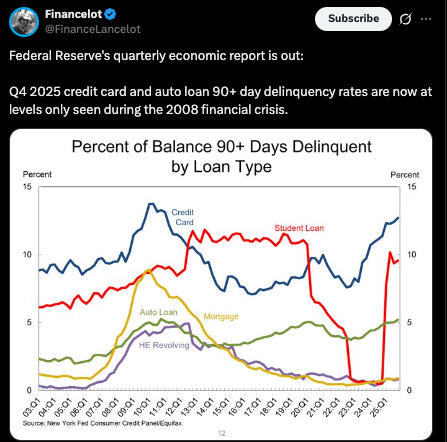
Source: https://x.com/FinanceLancelot/status/2021287600019894314
Lastly for the Economy section we’ll highlight a withering of heavy trucks sales - which can often coincide with recessions:
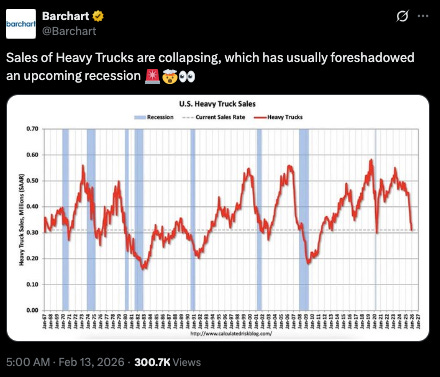
Source: https://x.com/Barchart/status/2022279762438185081
Part of the backstory on heavy trucks is the Trump Administration has enacted stricter federal enforcement of driver qualifications and school certifications which is creating a supply-side shock that could remove up to 250,000 drivers from the U.S. workforce by 2026.
Some consider this artificial tightening of capacity. Nevertheless, it is pushing freight rates upward as undercapitalized carriers exit and remaining fleets struggle with rising operational costs.
It remains to be seen if this supply-side shock to trucking produces the same result as a similar demand side shock.
Liquidity and ISM Overview:
South Korean exports often function as a lead for the ISM - which is pointing higher:
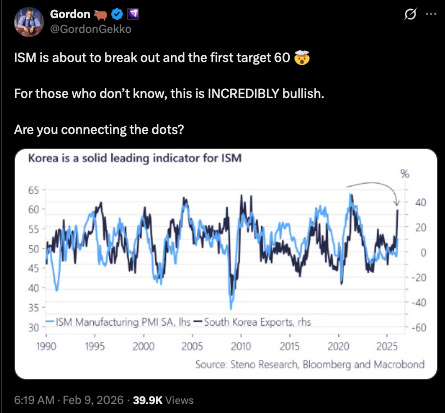
Source: https://x.com/GordonGekko/status/2020850101409685683
Four weeks ago, Korean equities were in a major run up:
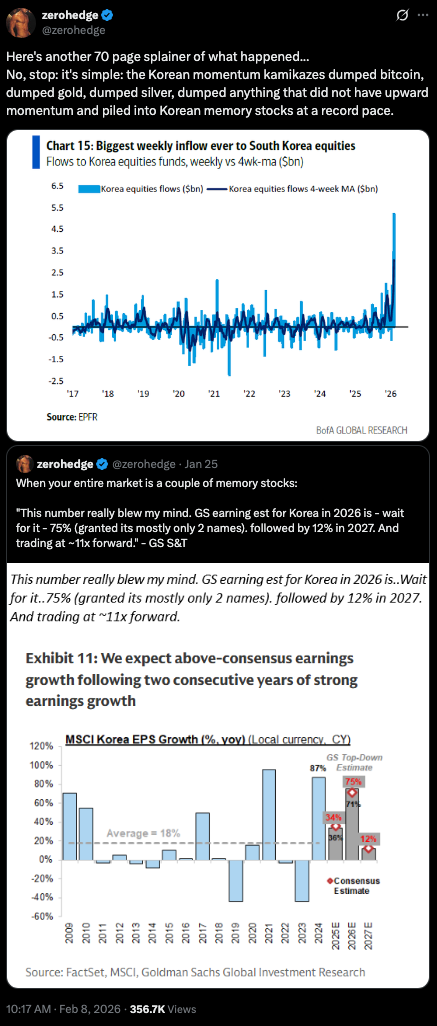
Source: https://x.com/zerohedge/status/2020547426721890811
Which saw the RSI for the KOSPI (South Korea) and TAIEK (Taiwan) shoot up dramatically:
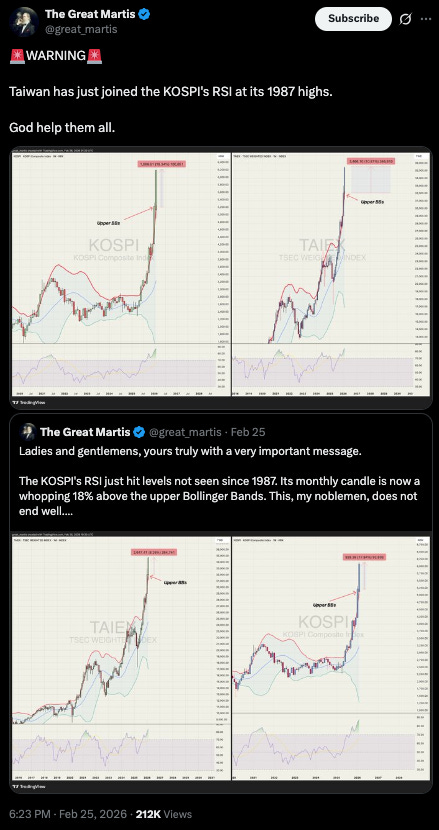
Source: https://x.com/great_martis/status/2026830505552089274
Just over the past few days, however, the KOSPI shed nearly 20% in two sessions after the Iran strikes (markets halted both days) - its worst two-day drop since 2008 - before recovering most of those losses Thursday on diplomacy hopes.
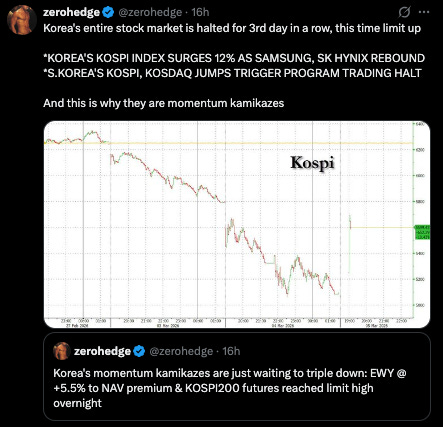
Source: https://x.com/zerohedge/status/2029348847072301565
Separately, PBoC liquidity is surging along with Gold:
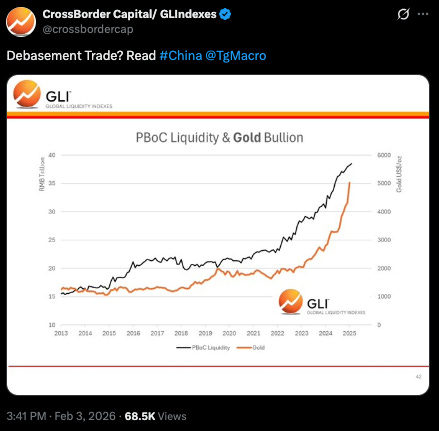
Source: https://x.com/crossbordercap/status/2018817168620814356
Federal Reserve Watch:
Iran creates another reason for the Fed to potentially cut rates, especially if oil spikes and equities sell off.
But the challenge will be that rate cuts might feed inflation.
For the moment, our favored chart of Fed Funds vs. the UST 2yr is showing flat to a small chance of a cut at upcoming Fed meetings:
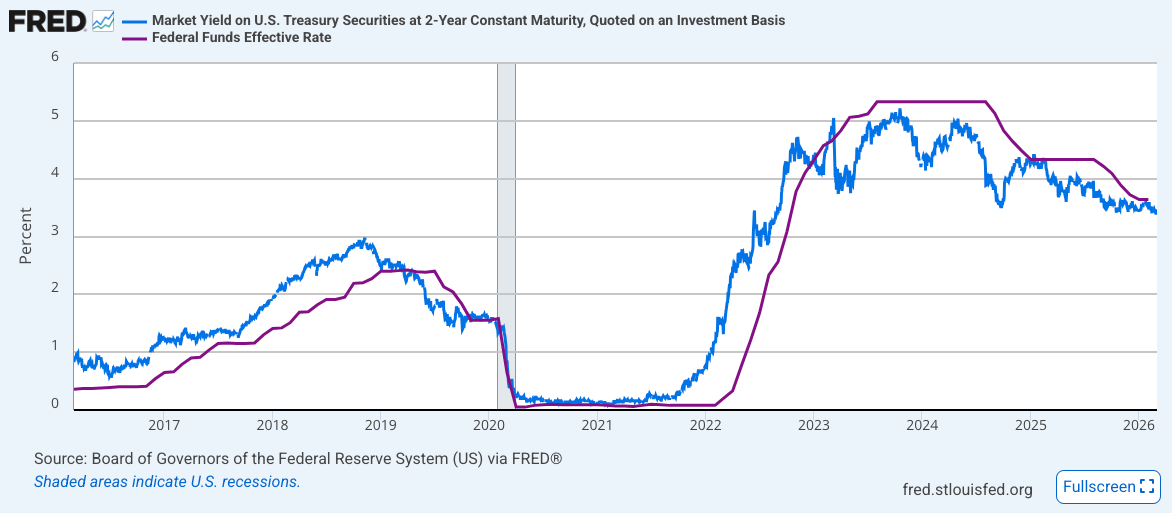
Source: https://fred.stlouisfed.org/series/DGS2
But while Trump appeased the US Bond market with the nomination of Kevin Warsh to the Fed Chair position, some are starting to see his policy flexibility:
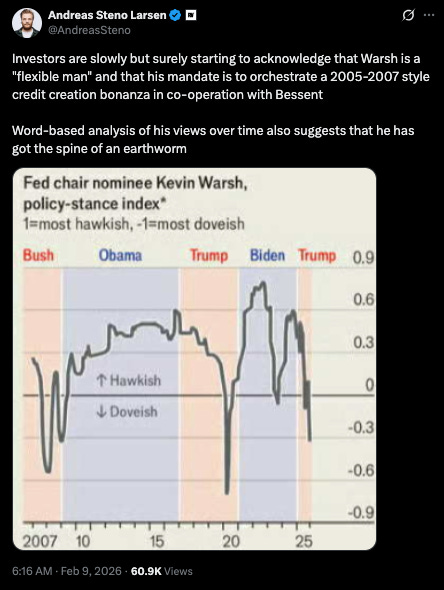
Source: https://x.com/AndreasSteno/status/2020849228977750486
Private credit looks like a potential canary in the coal mine:
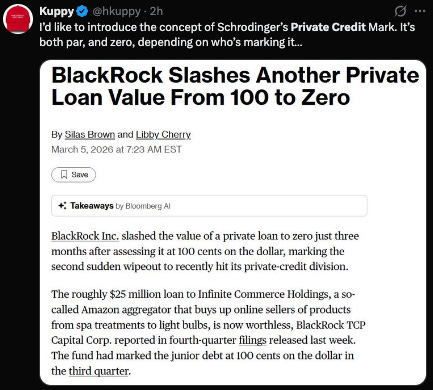
Source: https://x.com/hkuppy/status/2029561632930574481
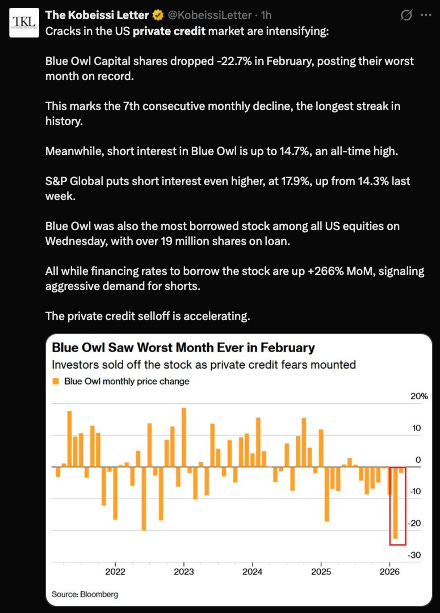
Source: https://x.com/KobeissiLetter/status/2029587490382970958
If this metastasizes then QE likely goes back on the table - Warsh and the fiscal hawks notwithstanding..
Geopolitics and Commodities:
Source: https://x.com/shanaka86/status/2027936080541131106
The main event this past month was the US and Israel's combined attack on Iran.
There’s a lot to cover here, and events are ongoing as this is being written.
But to set the scene, we need to first cover the issue of time relative to energy markets.
JPMorgan's math is simple and unforgiving. Onshore storage in the Gulf holds roughly 343 million barrels. Add 60 empty tankers that can serve as floating storage and you get maybe 3-4 extra days of buffer. Total runway: approximately 25 days from the start of the closure because they have nowhere to put the oil. That puts the wall at roughly March 25. (Source, Source)
Moreover, at this point, shut-ins have started: Iraq fully suspended production at Rumaila — the world's second-largest oil field — after storage tanks reached capacity
At this point, Trump has removed any timeline concerns entirely, saying Tuesday the war will last “until they reached their goals.”
The storage math doesn't care about political timelines.
Beyond day 25, analysts see Brent surpassing $100. Deutsche Bank says $200 if Iran mines the Strait.
We are now six days in. The clock is the story.
On Iran’s side, the most recent news is that Iran has retaliated to hit Fujairah in the UAE - a key bunkering and crude-loading hub that sits outside the Strait of Hormuz - and the Port of Salalah in Oman.
Everyone asks about workarounds to the Strait.
Saudi Arabia's East-West Pipeline (Petroline) has 5 million barrels per day of capacity, but was already running at elevated throughput from rerouting during the 2024-2025 Houthi campaign. (Source)
UAE's ADCOP pipeline to Fujairah adds limited spare.
Iraq’s Kirkuk-Ceyhan line to Turkey was designed for 1.6 million b/d but flows around 200,000 - it only restarted late 2025 after being shut down since March 2023, and its long-term operating agreement remains unresolved. As of March 3, Iraq halted crude exports through the Ceyhan pipeline entirely.
Total realistic spare bypass capacity: roughly 2.6-3.2 million barrels per day (Saudi+UAE). Normal Hormuz flow: 19-20 million.
Houthis have also announced, as of February 28, that they're resuming Red Sea attacks.
Next, underwriters and Trump’s response:
Major P&I clubs pulled war risk coverage effective March 5. (Source, Source)
Without insurance, no commercial vessel can legally transit, no bank will finance the cargo, no port will accept it.
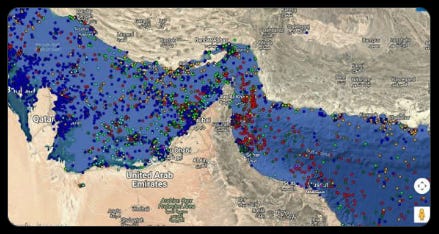
Tanker transits dropped from 24 per day to four on March 1 — three Iranian-flagged — and by March 2, effectively zero.
Clarksons estimates 3,200 ships idle in the Gulf with another 500 waiting outside.
The IRGC claims "complete control" as of Wednesday, but the insurance market enforced the blockade within 48 hours of the first strikes.
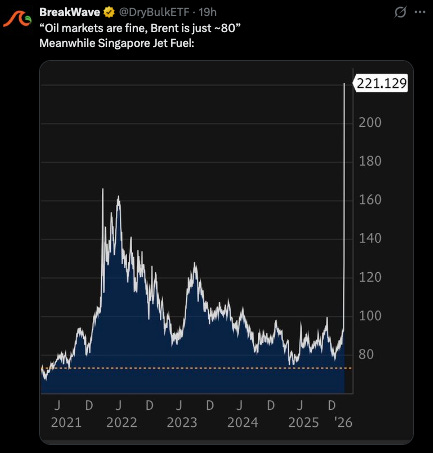
Trump's countermove Tuesday - DFC political risk insurance plus Navy escorts — initially, this cut the Dow's losses by roughly two-thirds and pulled Brent back from $85 intraday, but it remains to be seen where markets will go.
Source: https://x.com/DryBulkETF/status/2029305894131900844
Moreover, legal and financial limitations on what DFC can realistically provide appear to be significant.
What of the rest of the world? 20% of global energy flows through the Strait of Hormuz.
Europe has an immediate problem.
Europe cut Russian pipeline gas after Ukraine and pivoted to LNG. Now, roughly 12-14% of EU LNG imports came from Qatar.
Qatar’s Ras Laffan, the world's largest LNG export facility, shut down Monday after Iranian drone strikes.
EU gas storage sits at roughly 30% heading into refill season, well below the 44% at the same point last year. No strategic gas reserve system exists at the EU level.
As a result, European natural gas futures surged roughly 85% in 48 hours eventually doubling before falling back to 60% higher than pre war prices.
European bonds sold off for a third Strait session Wednesday, with Italian spreads widening to the most since November.
Traders went from pricing a 40% chance of an ECB rate cut on Friday to a 60%+ chance of a rate hike by year-end.
30% of Europe’s jet fuel transits Hormuz. The EU has no good options, and each day that passes without the Strait opening back up makes their challenge more acute.
Turning to China, China is the world’s largest energy importer and buys 80%+ of Iran’s shipped crude.
Roughly half of Chinese oil imports and a significant share of LNG imports transit Hormuz.
Beijing is pressing Iran directly - some reports indicate Iran is escorting Chinese vessels through the Strait.
Source: https://x.com/zerohedge/status/2028239944125386933
India is more exposed and has fewer options.
Roughly half of Indian crude depends on Hormuz routs. Additionally, a substantial share of LNG imports, estimated from 42-60% depending on the measure, transit the Strait. (Source)
Recently, India cut Russian oil imports under US trade deal pressure and is now lobbying for waivers to resume Russian purchases because Gulf supplies are at risk. Nomura flagged India among Asia’s most vulnerable economies.
Japan gets over 90% of its crude from the Middle East via Hormuz. They hold ~250 days of reserves but only 2-4 weeks of LNG.
South Korea sources roughly 71% of oil from the Gulf. Both will diversify immediately and permanently.
In a scenario where the war escalates or becomes protracted then US West Coast ports, the Panama Canal alternative, Alaska LNG, all become strategically urgent overnight.
The Venezuela action now looks like hemisphere energy housekeeping - securing Western Hemisphere energy supply before the Middle East disruption Washington knew was coming.
Russia, as you might expect, benefits from higher oil prices.
Revolution in Iran as the preferred -and cheapest- path for the US.
To set the stage, Iran’s domestic situation has been deteriorating for months. In late December, protests erupted at Tehran’s Grand Bazaar. In January, a series of massacres resulted in an estimated 30,000+ killed.
For days, now, Iran has been at roughly 1% internet connectivity.
US-Israeli cyber operations targeted IRGC command and control networks simultaneously with the first wave of strikes. The combination means state propaganda is offline, and coordination both military and civilian is a challenge. (Source)
Flashpoint reports Iran's state-sponsored hacking groups have "gone dark," though hacktivist proxy groups remain active. CrowdStrike sees no major state-sponsored cyber operations originating from Iran. Cloudflare’s CEO confirmed a “dramatic drop” in Iranian cyber activity. The command structure that oversaw Tehran's state-sponsored cyber operations appears severely disrupted. (Source)
The BadeSaba Calendar prayer app - 5 million downloads, primarily used by religious and pro-regime Iranians - was hijacked to push notifications reading “Help has arrived” and issuing surrender instructions to IRGC rank-and-file.
Flashpoint confirmed Iranian users screenshotted the messages before the regime could respond.
IRIB state television was hacked to broadcast Trump and Netanyahu in Persian.
If a revolution occurs in Iran, Hormuz reopens faster, oil normalizes faster, the geopolitical premium deflates and -maybe- the global economy returns to business as usual.
Wednesday’s New York Times report noted that Iranian intelligence operatives reached out to the CIA through a third country’s spy agency - even as Iran’s UN ambassador publicly refused negotiations - which suggesting the regime is fracturing internally.
Trump said they want to talk. Then said it’s “too late.” US officials now say there are no active negotiations and that potential off-ramps are unlikely to materialize in the near term — Defense Secretary Hegseth said the US was “just getting started.” So while the CIA outreach happened, the US response has been to enter a more intensive phase of operations, not to engage.
The result of all of this could be business as usual, Cold War 2, or something worse.
But every day the Strait stays closed, the number of actors with a reason to enter this conflict increases.
Even before the Iran War, oil was on the verge of a breakout:

Source: https://x.com/Barchart/status/2021891984407847421
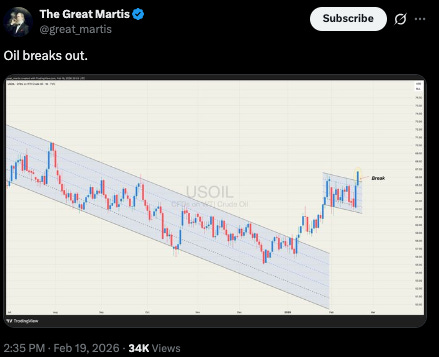
Source: https://x.com/great_martis/status/2024598865526288555
Which, given US oil drilling numbers (and the Iran War) should have some run now to run:
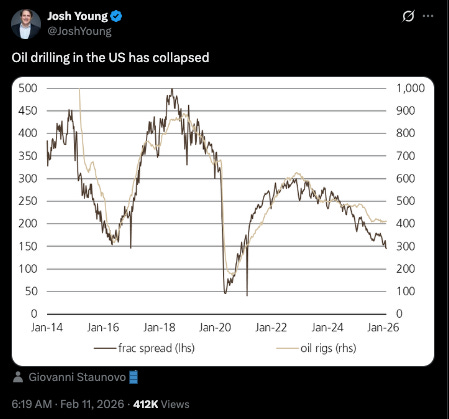
Source: https://x.com/JoshYoung/status/2021574713311420477
Similar for the Gold to Oil charts:
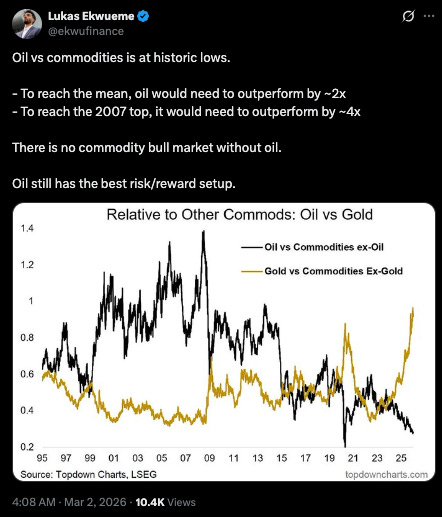
Source: https://x.com/ekwufinance/status/2028427170582757660
Turning to the rest of the commodities space:
In our February Compass we flagged energy as the next possible commodity to follow gold and silver’s breakout. Pretty decent timing.
The question now is whether this is a one-time geopolitical spike or confirmation of a structural cycle.
Pre-conflict, every major forecaster expected oversupply. That world assumed functioning chokepoints and peaceful trade routes.
Those expectations are gone now.
More broadly, copper deficit projections haven’t changed.
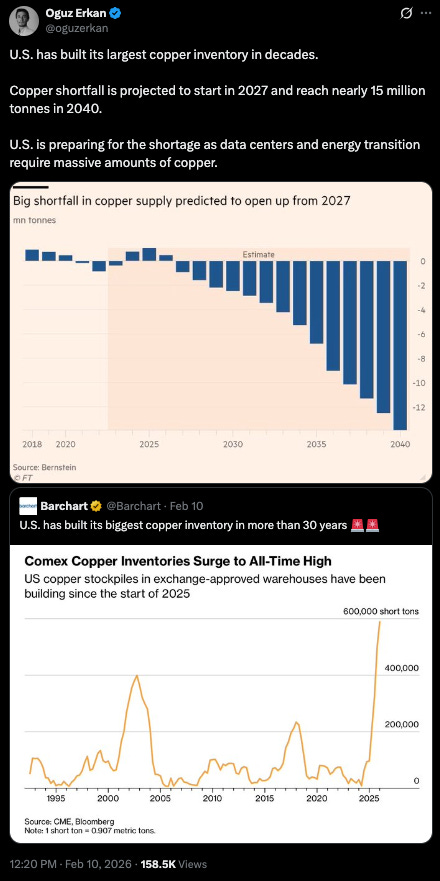
Source: https://x.com/Barchart/status/2021263556298027123
Source: https://x.com/oguzerkan/status/2021303260846415987
Mining capex decline hasn’t reversed. For example, new gold discoveries are at zero:
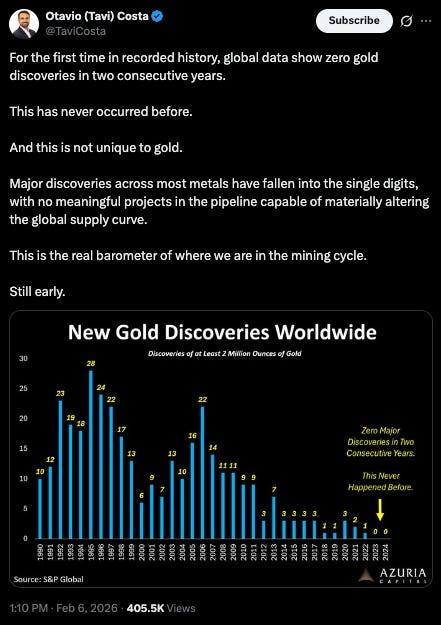
Source: https://x.com/TaviCosta/status/2019866206807945228
The End of Cold War 1 produced 30 years of globalization. If this is the beginning of Cold War 2, then that might reverse - potentially accelerating a developing commodities cycle:
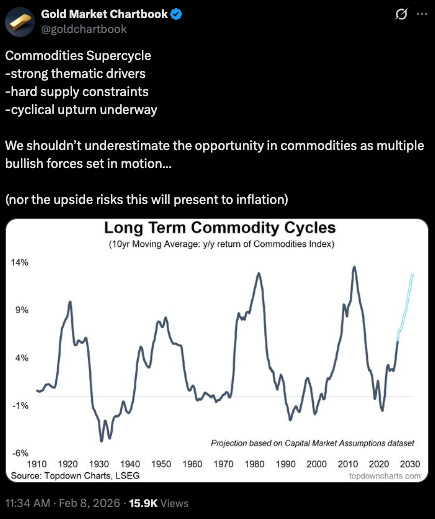
Source: https://x.com/goldchartbook/status/2020566913751892443
Which seems possible if global commodity equities lead the GSCI:
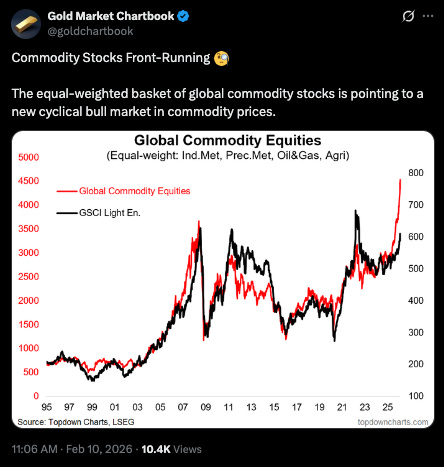
Source: https://x.com/goldchartbook/status/2021284719246123408
If you believe that commodities will follow Gold, then the upward move in commodities has at least some room to continue:
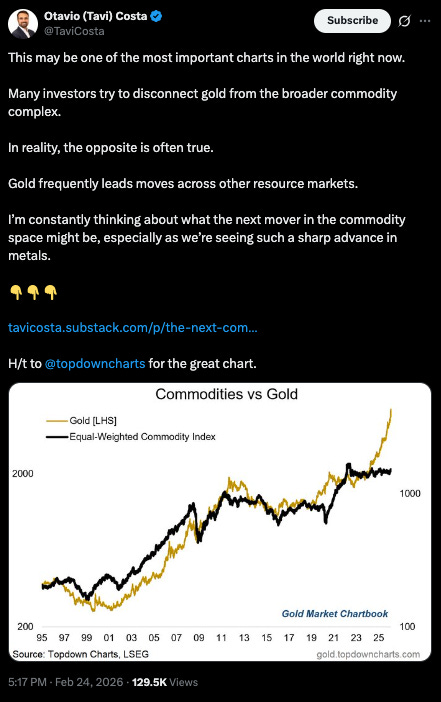
Source: https://x.com/TaviCosta/status/2026451345230684421
In early February, with the potential of continuing USD weakness, and commodities strength, investors were moving into emerging markets:
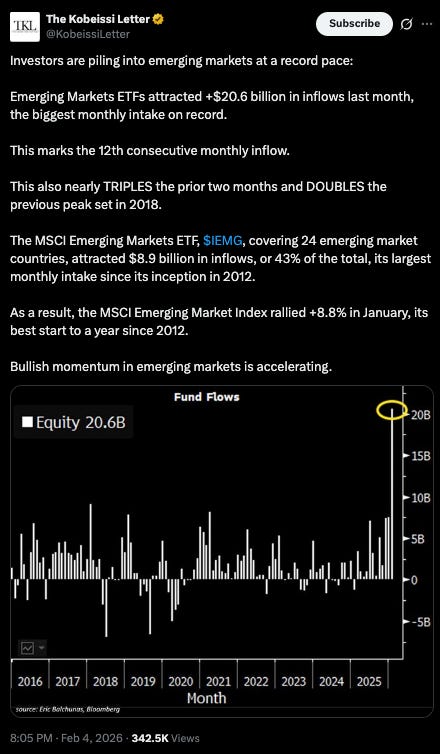
Source: https://x.com/KobeissiLetter/status/2019245973487464785
Gold bugs are hopeful for the long-awaited 3rd gold wave in modern times:
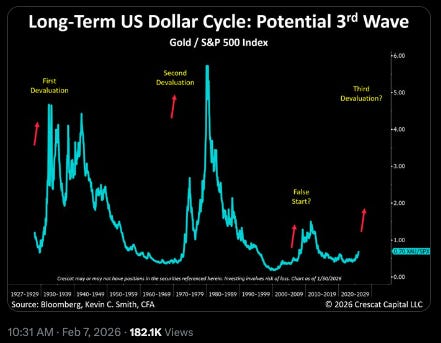
Source: https://x.com/crescatkevin/status/2020188570607317004
Seen differently, here’s what gold as a % of global equities’ market cap looks like:
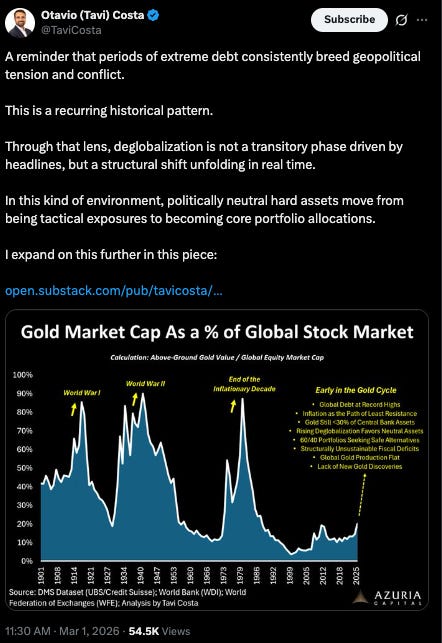
Source: https://x.com/TaviCosta/status/2028176043140415898
China is doing nothing to disabuse markets of that potential:
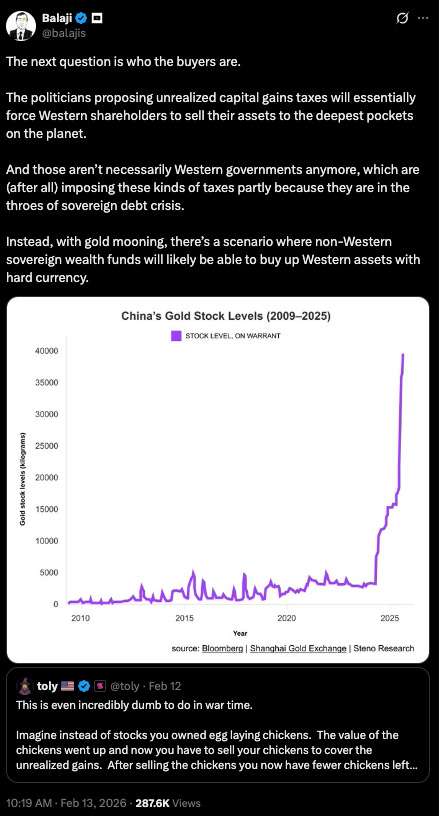
Source: https://x.com/balajis/status/2022360046122995851
Gold miners remain unloved:
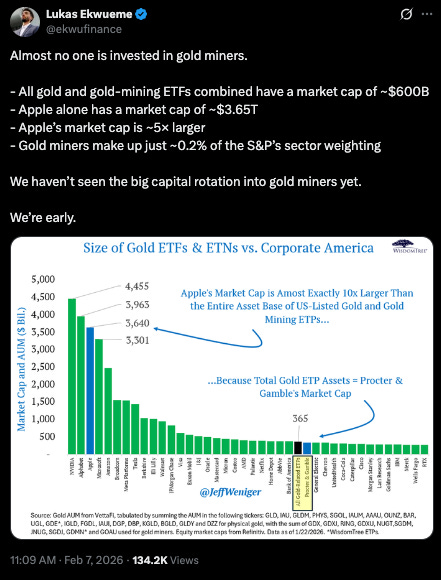
Source: https://x.com/ekwufinance/status/2020198187651235874
And the risk/reward on Brazilian equities looks manageable:
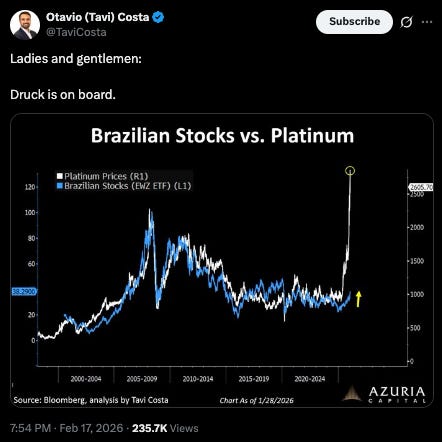
Source: https://x.com/TaviCosta/status/2023954212883718272
Cryptos:
Crypto and Bitcoin took a bit of a back seat this past month for obvious reasons. Bitcoin enthusiasts are currently trying to cope with why Bitcoin is not performing well.
Bitcoin is currently trading in the low ~$70,000s area, up to a one-month high after bouncing from $62-63K. This is still nearly half off its $126K October all-time high.
Bitcoin enthusiasts were excited by news this past month of a pending lawsuit against Jane Street, a quantitative trading giant that acts as an authorized participant for BlackRock's IBIT and other spot Bitcoin ETFs.
Terraform Labs' bankruptcy administrator accused the firm of insider trading that hastened Terra's 2022 collapse.
Crypto Twitter immediately connected this to a separate grievance: a persistent pattern of BTC selling pressure at 10 AM ET every trading day, right at the stock market open, that many traders had been flagging for months.
The theory is that Jane Street was algorithmically dumping Bitcoin at the open to push spot prices down, then buying IBIT shares at a discount.
When the lawsuit dropped, the 10 AM pattern vanished. Bitcoin rallied 10% in two days. Jane Street wiped its X account. The circumstantial optics were terrible.
On the regulatory front, Trump this week sided with Coinbase against banks in the ongoing fight over the stalled Clarity Act - signaling continued White House support for crypto legislation, even as the market ignores it. But Trump has yet to get the Clarity Act across the finish line, leaving the broader crypto market structure questions unresolved.
But in subsequent days, Bitcoin’s price has tracked mostly sideways with a bit of upward movement.
The question remains, what’s going on in the crypto/Bitcoin world:
For context, Bitcoin appears to be breaking down against Gold:
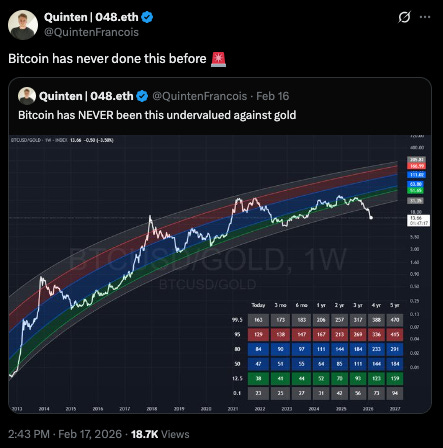
Source: https://x.com/QuintenFrancois/status/2023875927634309503
And instead trading almost exactly on top of the software selloff from AI.
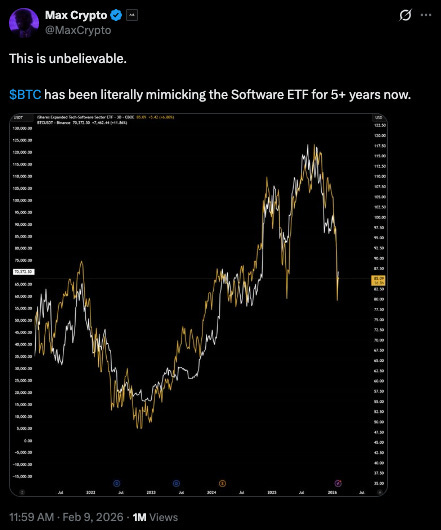
Source: https://x.com/MaxCrypto/status/2020935641929015622
Some are coping by zooming out to the full 17 year history of Bitcoin:
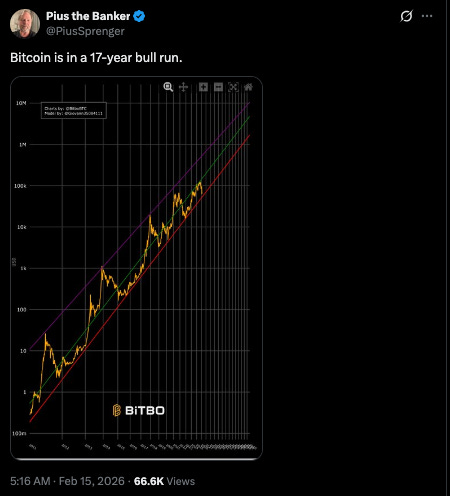
Source: https://x.com/PiusSprenger/status/2023008609991582077
One interesting tidbit for the future is that Bitcoin is advancing toward Quantum durability - which would address the risk that quantum computing disrupts Bitcoin:
https://www.zerohedge.com/crypto/bitcoin-advances-toward-quantum-resistance-proposed-update
Some in the Bitcoin world are looking at the rising ISM as the potential catalyst to vault Bitcoin back into orbit:
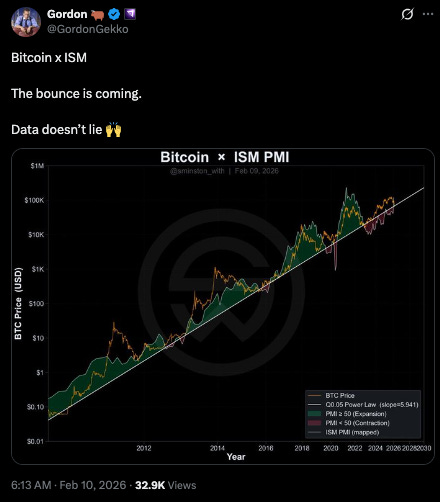
Source: https://x.com/GordonGekko/status/2021210807028097154
In my mind, the big question that none of this resolves is why Bitcoin is trading like a software equity.
So for the time being, I’m keeping an eye on how much further Bitcoin might fall:
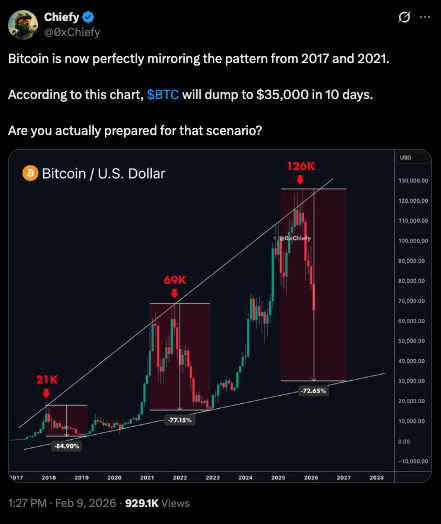
Source: https://x.com/0xChiefy/status/2020957776688849316
Which looks like it could be a bit further:
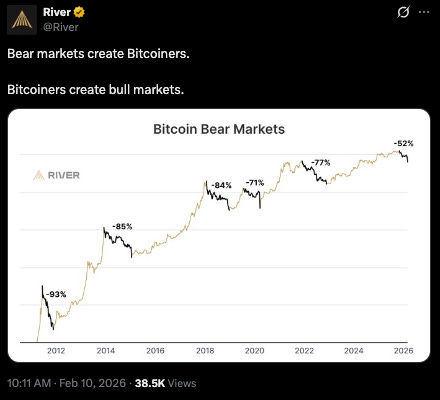
Source: https://x.com/River/status/2021270862033203363
Equities:
Equities simply look challenged at the moment:
Source: (click the image)
Michael Burry may be adding to his Palantir short thesis:
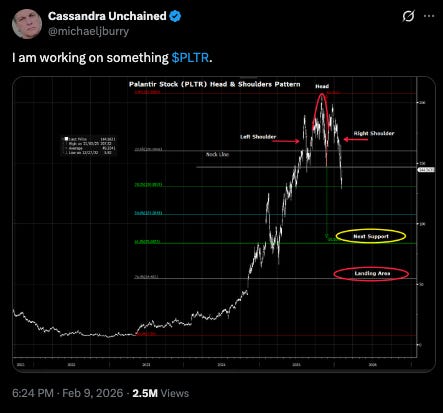
Source: https://x.com/michaeljburry/status/2021032594645639584
Hindenburg omens are flying:
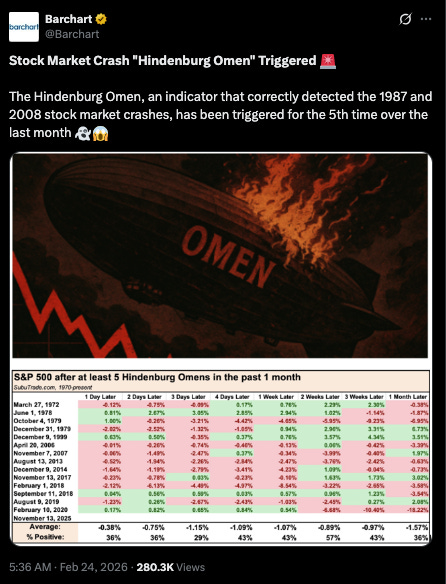
Source: https://x.com/Barchart/status/2026274915431874761
Equities can be viewed through a series of lenses:
In the market breadth view, the top 10 stocks vs the next 40 show the AI bet in dramatic fashion:
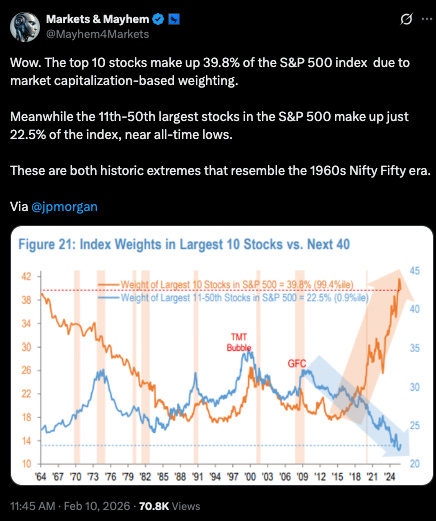
https://x.com/Mayhem4Markets/status/2021294556298224003
Here's Nvidia's quarterly revenue trajectory - the AI buildout in one chart:
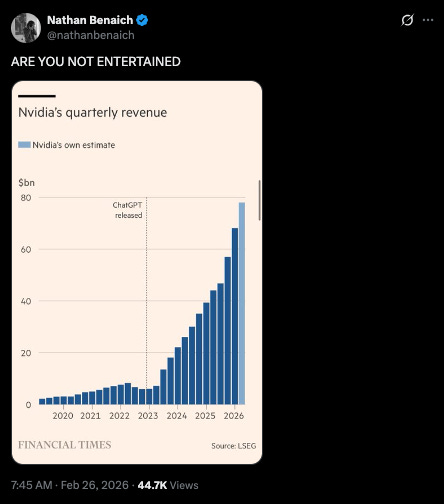
Source:
https://x.com/nathanbenaich/status/2027032255194153057
Value stocks look ready to overtake growth stocks:
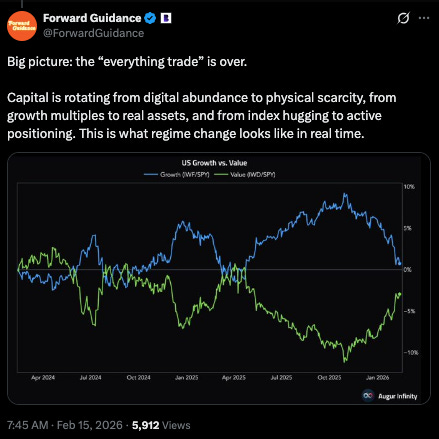
Source: https://x.com/ForwardGuidance/status/2023045912759542127
Software has completely decoupled from the rest of the Nasdaq: (IGV vs NDX)
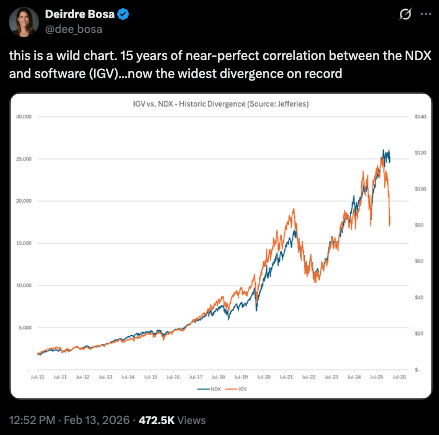
Source: https://x.com/dee_bosa/status/2022398546893554046
DOW gains might be a mirage:
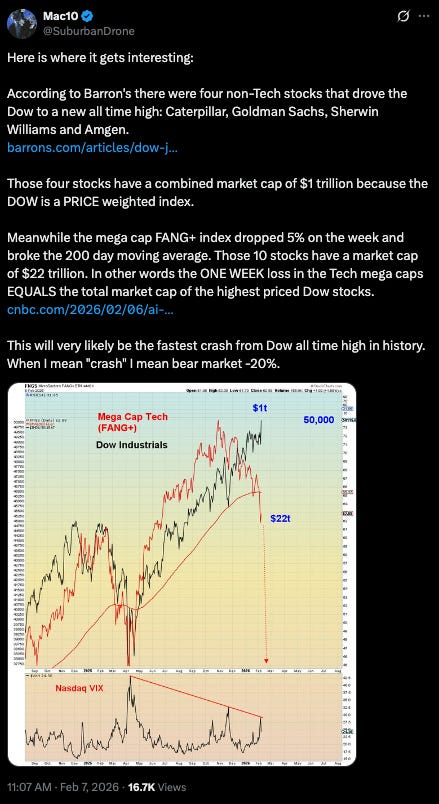
Source: https://x.com/SuburbanDrone/status/2020197683034493304
If we are at the end of a 1998 style tech bubble, then the next decade of returns looks bleak:
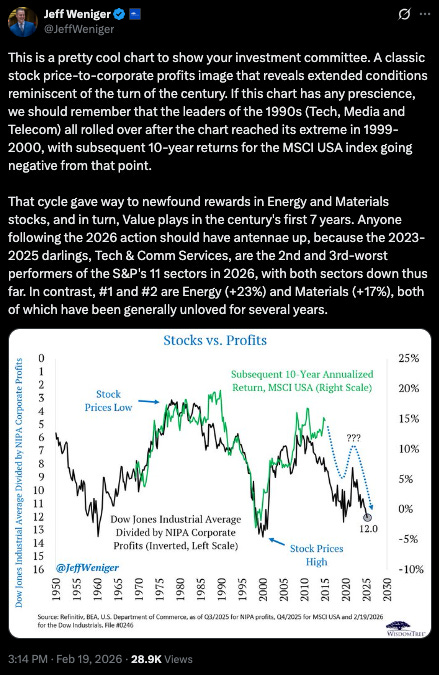
Source: https://x.com/JeffWeniger/status/2024608636325044282
Is a selloff imminent?:
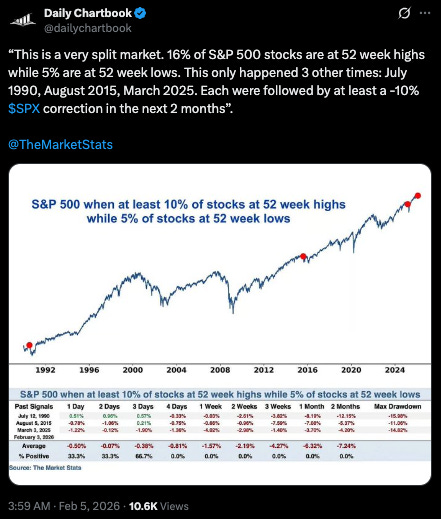
Source: https://x.com/dailychartbook/status/2019365224155885900
Only time will tell.
Conclusion:
The phrase I keep coming back to is one I used on the first day of the conflict: the pain is not symmetrical.
The US produces 13.5 million barrels of oil per day, is the world’s largest LNG exporter, holds the reserve currency, and is running the military operation. None of that makes America immune - gas prices are rising, markets are volatile, and the Fed just inherited a stagflationary setup. But compared to everyone else, the US looks pretty good right now.
Europe cut Russian pipeline gas after Ukraine and pivoted to Qatar LNG. Ras Laffan is now offline. EU gas storage sits below 30% heading into refill season. European natural gas doubled in 48 hours.
German, French, and Italian sovereign bonds sold off harder than US bonds did in a single session. European bond markets are not pricing safety. They are pricing stagflation - and their version is worse than the US’s.
Asia gets 70% of Hormuz crude. Japan holds ~250 days of oil reserves but only 2-4 weeks of LNG. China bought over 80% of Iran’s shipped oil last year. India gets half its crude through the same chokepoint. The US is not unscathed. But it is the least exposed major economy on the board - and that gap is structural, not situational. This war just made it visible.
So the scenarios I’m watching are:
A quick revolution by the Iranian people, returning the Gulf to a business similar to usual, with disruption of Iranian oil flows, and some regional hubs as they rebuild from attacks.
a protracted campaign that hardens into Cold War 2 — supply chains fracture, prices move higher on every supply chain realignment.
Escalation, brinksmanship, and larger conflict risks between US, the EU, Russia, and China.
The challenge that I see is that the Strait of Hormuz closing acts as a tariff the world will pay on energy, and which the US - more than any other country will reap the benefits of. A longer war makes life harder for Asia, and chastises the EU, all while the US gets paid for its energy. So unless the US can exercise restraint, US leaders will be incentivized to push the war longer - which in turn risks escalation.
In the absence of knowing which scenario will play out, I still like the commodity cycle thesis I laid out in last month’s Compass: energy likely to follow gold and silver’s breakout, copper in structural deficit, physical assets outperforming equities - that thesis continues to evolve. Equities, crypto, private credit, bonds - too many asset classes are flashing warning signs simultaneously, even as the ISM moves higher. Nothing seems to have changed the calculus around the potential for a commodities cycle, if anything (and regardless of which scenario we get) this month’s events have heightened that potential.
Until next month.
If you are new here, please consider subscribing.